Harvest: Fire Incidents, Alabama (AL)
Where are fire incidents reported in Harvest, AL
Something went wrong! Please refresh the page.
|
| |||||||||||||||||||||||||||||||||||||||||||||||||||||||||||||||||||||||||||||||||||||||||||||||||||||||||||||
2003 - 2018 National Fire Incident Reporting System (NFIRS) incidents
- Incident types reported to NFIRS in Harvest, AL
- 77251.0%Rescue & EMS
- 28118.5%Good Intent Call
- 25717.0%Fire
- 1157.6%False Alarm
- 815.3%Hazardous Condition
- 80.5%Service Call
- Fire incident types reported to NFIRS in Harvest, AL
- 13351.8%Outside Fires
- 9537.0%Structure Fires
- 166.2%Mobile Property/Vehicle Fires
- 135.1%Other
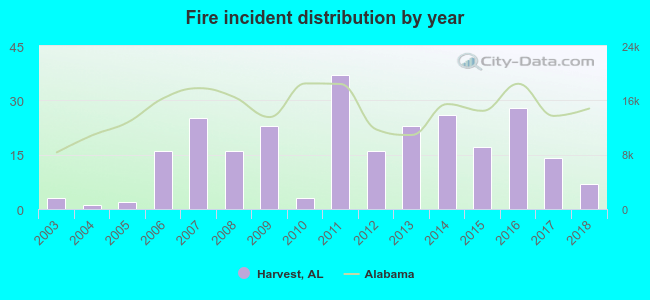 According to the data from the years 2003 - 2018 the average number of fire incidents per year is 16. The highest number of fires - 37 took place in 2011, and the least - 1 in 2004. The data has an increasing trend.
The average number of yearly fire incidents per 10k residents in Harvest, AL compared to nearest cities:
(Note: Based on data for the last 3 years, including only cities with population 5,000 and above)
| Harvest: | 30.9 |
| Madison: | 15.0 |
| Meridianville: | 14.9 |
| Huntsville: | 42.6 |
| Athens: | 38.1 |
| Decatur: | 46.8 |
| Hartselle: | 31.6 |
| Danville: | 1.6 |
| Arab: | 62.0 |

 28.0% incidents where reported in the morning and 72.0% in the evening. The most fires (17.1%) took place on Tuesday, and the least (11.7%) on Monday.
 Based on the 257 fires from years 2003 - 2018 most fires (13.6%) took place during March, and the least (4.3%) in September.
 Out of all 1,515 cases reported during the years 2003 - 2018, the most belonged to the categories: Overpressure Rupture (51.0%), Service Call (18.5%), and Fire (17.0%).
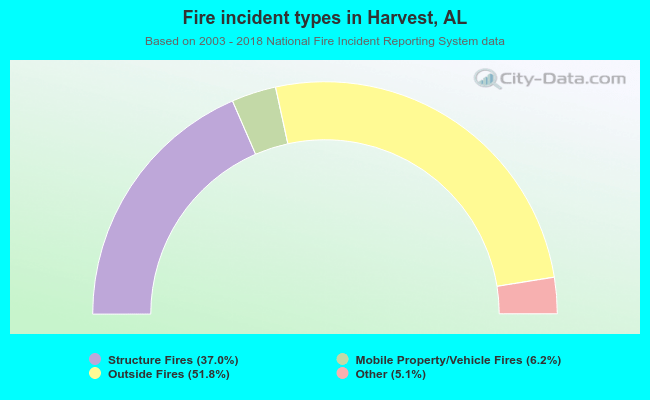 When looking into fire subcategories, the most incidents belonged to: Outside Fires (51.8%), and Structure Fires (37.0%).