Haslett: Fire Incidents, Michigan (MI)
Where are fire incidents reported in Haslett, MI
Something went wrong! Please refresh the page.
|
| |||||||||||||||||||||||||||||||||||||||||||||||||||||||||||||||||||||||||||||||||||||||||||||||||||||||||||||
2002 - 2018 National Fire Incident Reporting System (NFIRS) incidents
- Incident types reported to NFIRS in Haslett, MI
- 4,09671.4%Rescue & EMS
- 5239.1%Service Call
- 3816.6%Fire
- 3626.3%Hazardous Condition
- 1893.3%False Alarm
- 1422.5%Good Intent Call
- 360.6%Special Incident
- Fire incident types reported to NFIRS in Haslett, MI
- 19852.0%Structure Fires
- 10527.6%Outside Fires
- 6316.5%Mobile Property/Vehicle Fires
- 153.9%Other
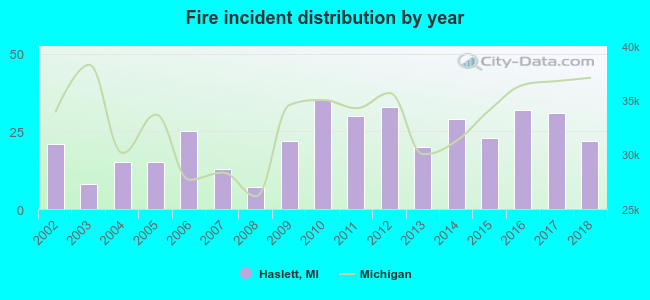 According to the data from the years 2002 - 2018 the average number of fires per year is 22. The highest number of reported fire incidents - 35 took place in 2010, and the least - 7 in 2008. The data has an increasing trend.
The average number of yearly fire incidents per 10k residents in Haslett, MI compared to nearest cities:
(Note: Based on data for the last 3 years, including only cities with population 5,000 and above)
| Haslett: | 14.7 |
| Okemos: | 23.4 |
| East Lansing: | 30.9 |
| Lansing: | 49.1 |
| Holt: | 21.0 |
| Mason: | 101.8 |
| Grand Ledge: | 93.3 |
| Owosso: | 55.9 |
| Eaton Rapids: | 87.5 |
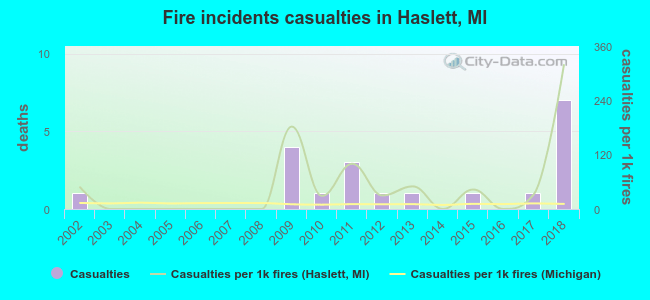 According to the data from the years 2002 - 2018 the average number of fire-related casualties per year is 1. The highest number of casualties - 7 took place in 2018, and the lowest - 0 in 2003. The data has a growing trend.
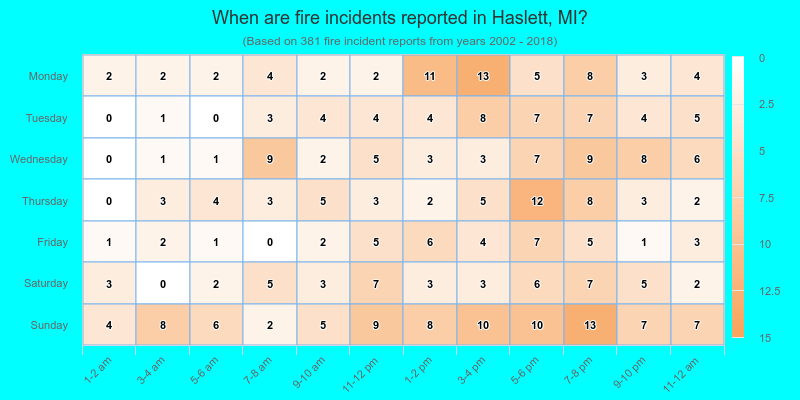
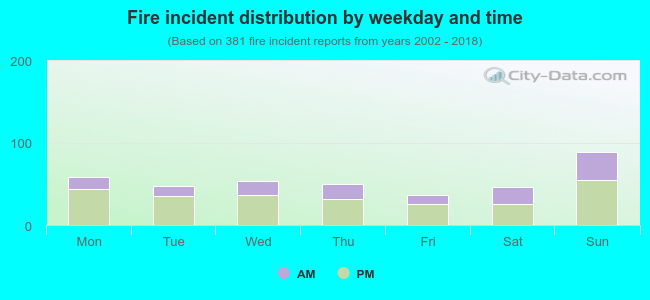 33.3% incidents where reported in the morning and 66.7% in the evening. The most fires (23.4%) took place on Sunday, and the least (9.7%) on Friday.
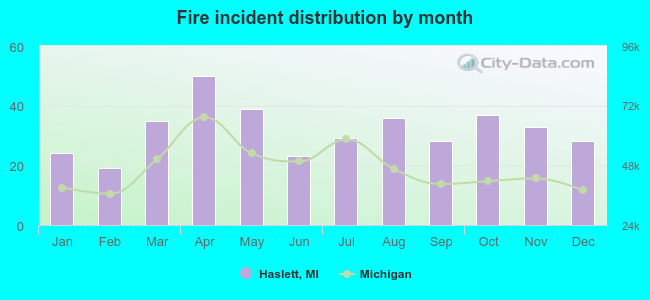 Based on the 381 incident reports from years 2002 - 2018 most fires (13.1%) took place during April, and the least (5.0%) in February.
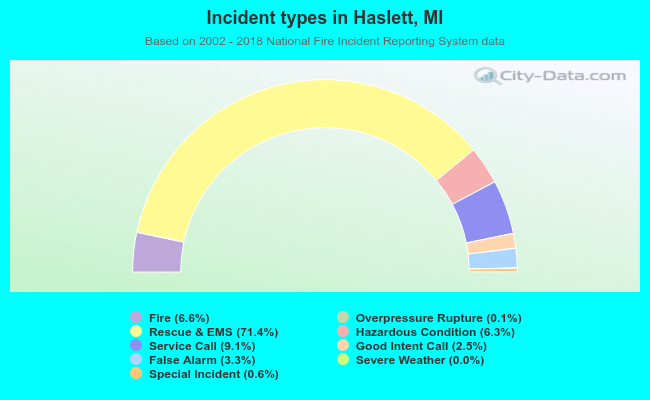 Out of all 5,734 cases reported during the years 2002 - 2018, the most belonged to the categories: Rescue & EMS (71.4%), Service Call (9.1%), and Fire (6.6%).
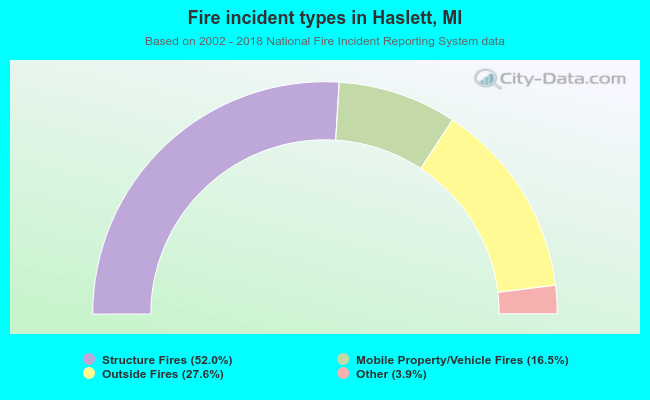 When looking into fire subcategories, the most reports belonged to: Structure Fires (52.0%), and Outside Fires (27.6%).