Lansing: Fire Incidents, Michigan (MI)
Where are fire incidents reported in Lansing, MI
Something went wrong! Please refresh the page.
| Fire incidents reported | |
|---|---|
| Sreet name | Count |
| SAGINAW HWY | 412 |
| MICHIGAN AVE | 402 |
| CEDAR ST | 312 |
| JOLLY RD | 274 |
| KING BLVD | 274 |
| PENNSYLVANIA AVE | 264 |
| WAVERLY RD | 244 |
| GRAND RIVER AVE | 238 |
| WASHINGTON AVE | 220 |
| SAGINAW ST | 210 |
| EDGEWOOD BLVD | 188 |
| KALAMAZOO ST | 184 |
| MT HOPE AVE | 132 |
| CREYTS RD | 102 |
| PINE ST | 100 |
| HOLMES RD | 98 |
| MILLER RD | 98 |
| WILLOW HWY | 88 |
| BURNEWAY DR | 82 |
| CAVANAUGH RD | 80 |
| SHIAWASSEE ST | 80 |
| WILLOW ST | 76 |
| AURELIUS RD | 74 |
| CANAL RD | 74 |
| MALL DR | 72 |
| WASHINGTON SQ | 72 |
| REO RD | 70 |
| TURNER ST | 68 |
| RICHWOOD ST | 66 |
| LARCH ST | 64 |
| Other | 3,080 |
2002 - 2018 National Fire Incident Reporting System (NFIRS) incidents
- Incident types reported to NFIRS in Lansing, MI
- 76,32972.1%Rescue & EMS
- 7,7987.4%Fire
- 6,7066.3%Hazardous Condition
- 5,3415.0%Service Call
- 4,9434.7%False Alarm
- 4,4454.2%Good Intent Call
- 2360.2%Special Incident
- Fire incident types reported to NFIRS in Lansing, MI
- 3,84449.3%Structure Fires
- 1,92424.7%Outside Fires
- 1,41918.2%Mobile Property/Vehicle Fires
- 6117.8%Other
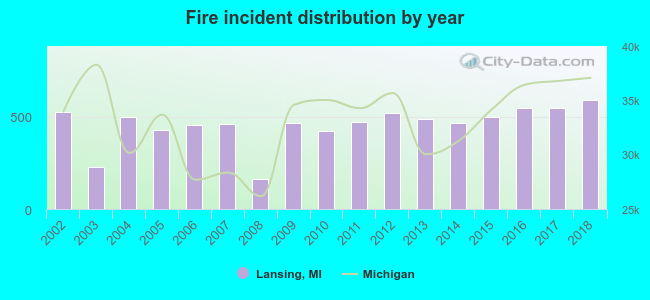 According to the data from the years 2002 - 2018 the average number of fires per year is 459. The highest number of fire incidents - 590 took place in 2018, and the least - 163 in 2008. The data has a growing trend.
The average number of yearly fire incidents per 10k residents in Lansing, MI compared to nearest cities:
(Note: Based on data for the last 3 years, including only cities with population 5,000 and above)
| Lansing: | 49.1 |
| East Lansing: | 30.9 |
| Holt: | 21.0 |
| Okemos: | 23.4 |
| Haslett: | 14.7 |
| Grand Ledge: | 93.3 |
| Mason: | 101.8 |
| Eaton Rapids: | 87.5 |
| Charlotte: | 81.7 |
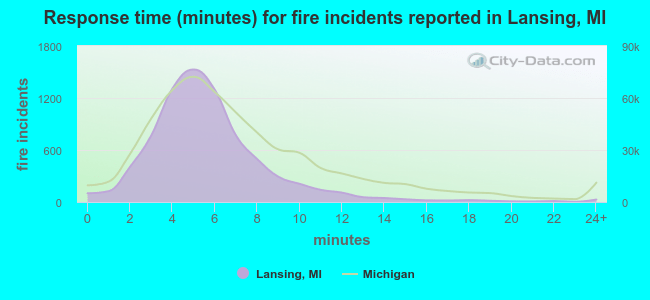 The median response time based on all reported fire incidents is 5 minutes. This is lower compared to the state median value.
The median response time in Lansing, MI compared to nearest cities:
(Note: Based on data for all years, including only cities with at least 500 fire incidents)
| Lansing: | 5 minutes |
| East Lansing: | 7 minutes |
| Holt: | 4 minutes |
| Okemos: | 7 minutes |
| Grand Ledge: | 7 minutes |
| Mason: | 8 minutes |
| Eaton Rapids: | 10 minutes |
| Charlotte: | 6 minutes |
| Fowlerville: | 11 minutes |
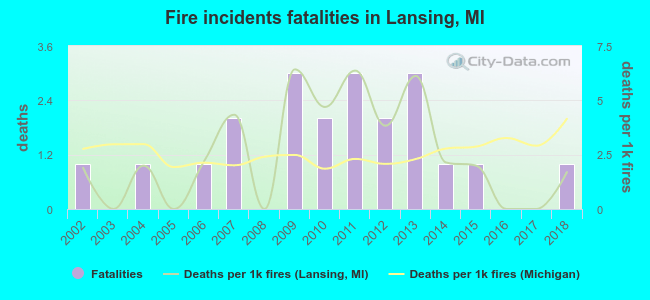 Based on the reports from the years 2002 - 2018 the average number of fire-related yearly deaths is 1. The highest number of reported deaths - 3 took place in 2009, and the lowest - 0 in 2003. The data has a constant trend.
The average number of deaths per 1,000 fires is 3. This indicator was the highest - 6 in 2009, and the lowest 0 in 2003. The trend for fatalities per 1,000 fire incidents is dropping. Compared to the Michigan value the number of fatalities per 1,000 fire incidents is about the same.
Based on the reports from the years 2002 - 2018 the average number of fire-related yearly deaths is 1. The highest number of reported deaths - 3 took place in 2009, and the lowest - 0 in 2003. The data has a constant trend.
The average number of deaths per 1,000 fires is 3. This indicator was the highest - 6 in 2009, and the lowest 0 in 2003. The trend for fatalities per 1,000 fire incidents is dropping. Compared to the Michigan value the number of fatalities per 1,000 fire incidents is about the same.Deaths per 1,000 incidents in Lansing, MI compared to nearest cities:
(Note: Based on data for all years, including only cities with at least 2,500 fire incidents)
| Lansing: | 2.7 |
| Jackson: | 1.4 |
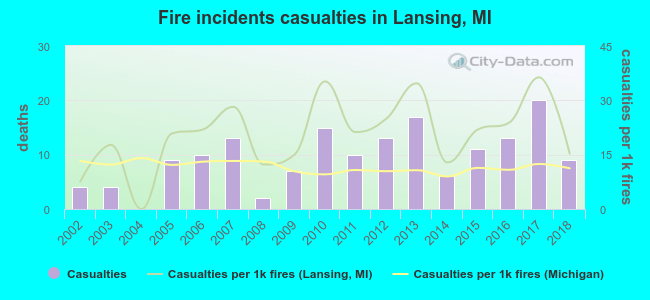 According to the reports from the years 2002 - 2018 the average number of fire-related casualties per year is 10. The highest number of reported injuries - 20 took place in 2017, and the lowest - 0 in 2004. The data has an increasing trend.
The average number of injuries per 1,000 fire incidents is 21. This indicator was the highest - 36 in 2017, and the lowest 0 in 2004. The trend for injuries per 1,000 incidents is increasing. Compared to the state value the number of injuries per 1,000 fire incidents is higher.
According to the reports from the years 2002 - 2018 the average number of fire-related casualties per year is 10. The highest number of reported injuries - 20 took place in 2017, and the lowest - 0 in 2004. The data has an increasing trend.
The average number of injuries per 1,000 fire incidents is 21. This indicator was the highest - 36 in 2017, and the lowest 0 in 2004. The trend for injuries per 1,000 incidents is increasing. Compared to the state value the number of injuries per 1,000 fire incidents is higher.Casualties per 1,000 incidents in Lansing, MI compared to nearest cities:
(Note: Based on data for all years, including only cities with at least 500 fire incidents)
| Lansing: | 20.9 |
| East Lansing: | 11.6 |
| Holt: | 12.5 |
| Okemos: | 32.5 |
| Grand Ledge: | 10.7 |
| Mason: | 1.3 |
| Eaton Rapids: | 11.1 |
| Charlotte: | 20.3 |
| Fowlerville: | 3.7 |
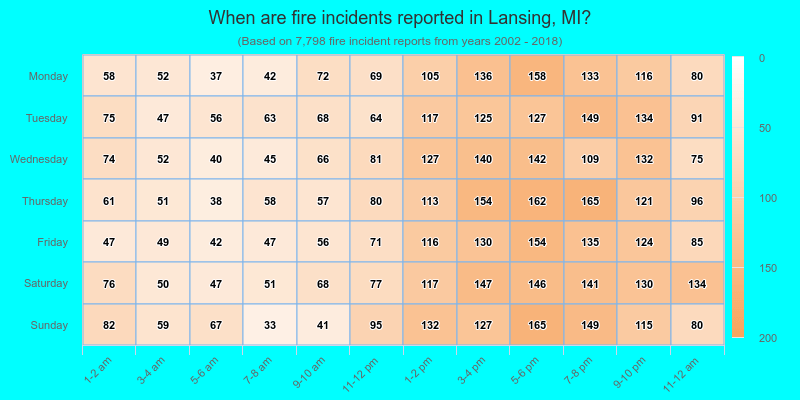
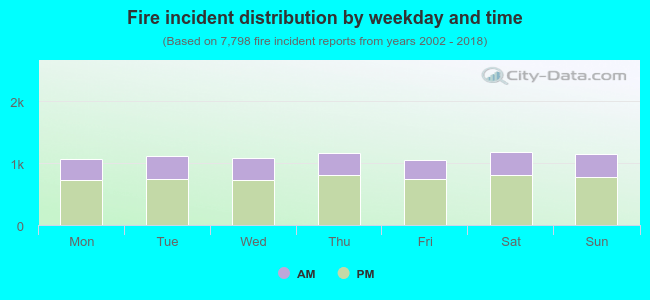 31.6% incidents where reported in the morning and 68.4% in the evening. The most fires (15.2%) took place on Saturday, and the least (13.5%) on Friday.
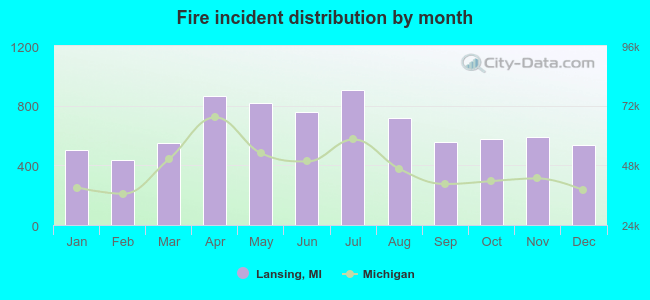 According to the 7,798 fire incident reports from years 2002 - 2018 most fires (11.6%) took place during July, and the least (5.6%) in February.
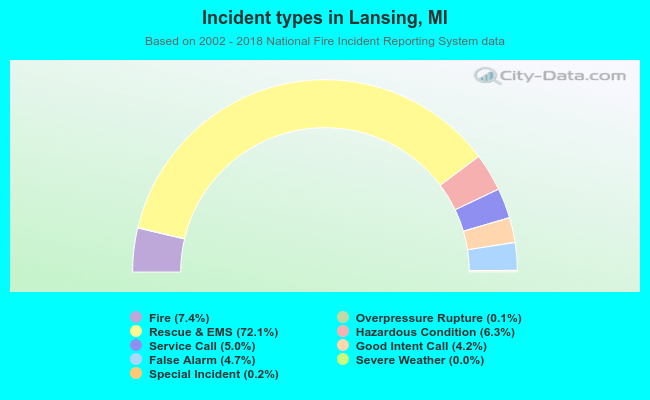 Out of all 105,898 cases reported during the years 2002 - 2018, the most belonged to the categories: Rescue & EMS (72.1%), Fire (7.4%), and Hazardous Condition (6.3%).
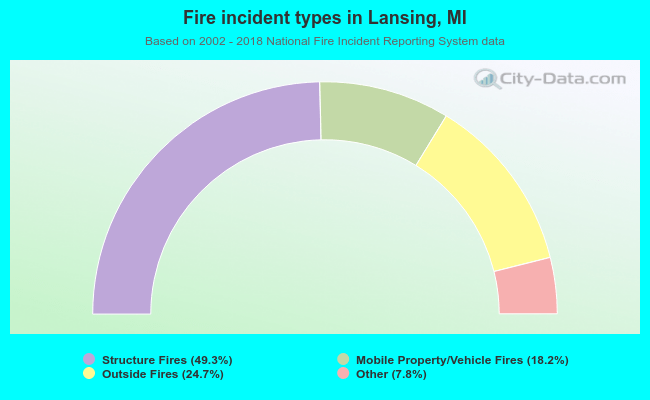 When looking into fire subcategories, the most reports belonged to: Structure Fires (49.3%), and Outside Fires (24.7%).