Mason: Fire Incidents, Michigan (MI)
Where are fire incidents reported in Mason, MI
Something went wrong! Please refresh the page.
|
| |||||||||||||||||||||||||||||||||||||||||||||||||||||||||||||||||||||||||||||||||||||||||||||||||||||||||||||
2002 - 2018 National Fire Incident Reporting System (NFIRS) incidents
- Incident types reported to NFIRS in Mason, MI
- 85129.5%Rescue & EMS
- 76326.5%Fire
- 56119.5%Hazardous Condition
- 2799.7%Good Intent Call
- 2358.2%False Alarm
- 1625.6%Service Call
- 120.4%Severe Weather
- 110.4%Special Incident
- 60.2%Overpressure Rupture
- Fire incident types reported to NFIRS in Mason, MI
- 43857.4%Structure Fires
- 16922.1%Outside Fires
- 11414.9%Mobile Property/Vehicle Fires
- 425.5%Other
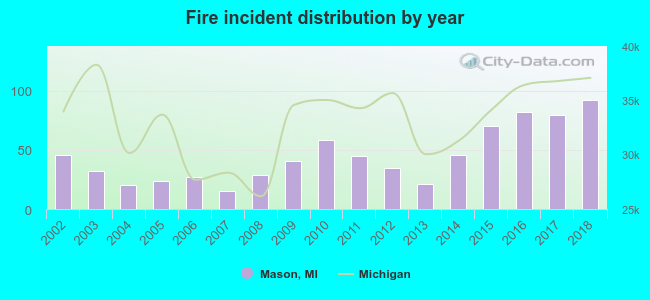 Based on the data from the years 2002 - 2018 the average number of fires per year is 45. The highest number of reported fires - 92 took place in 2018, and the least - 15 in 2007. The data has an increasing trend.
The average number of yearly fire incidents per 10k residents in Mason, MI compared to nearest cities:
(Note: Based on data for the last 3 years, including only cities with population 5,000 and above)
| Mason: | 101.8 |
| Holt: | 21.0 |
| Okemos: | 23.4 |
| Lansing: | 49.1 |
| East Lansing: | 30.9 |
| Eaton Rapids: | 87.5 |
| Haslett: | 14.7 |
| Grand Ledge: | 93.3 |
| Charlotte: | 81.7 |
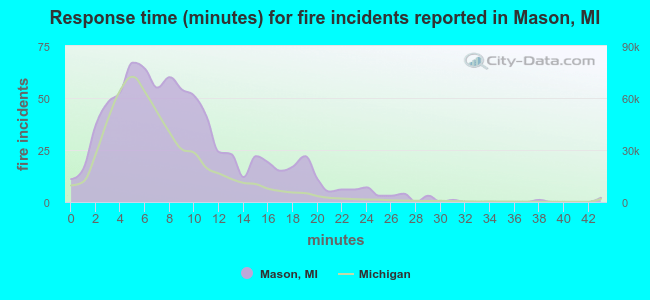 The median response time based on all reported fire incidents is 8 minutes. This is higher compared to the Michigan median value.
The median response time in Mason, MI compared to nearest cities:
(Note: Based on data for all years, including only cities with at least 500 fire incidents)
| Mason: | 8 minutes |
| Holt: | 4 minutes |
| Okemos: | 7 minutes |
| Lansing: | 5 minutes |
| East Lansing: | 7 minutes |
| Eaton Rapids: | 10 minutes |
| Grand Ledge: | 7 minutes |
| Fowlerville: | 11 minutes |
| Charlotte: | 6 minutes |
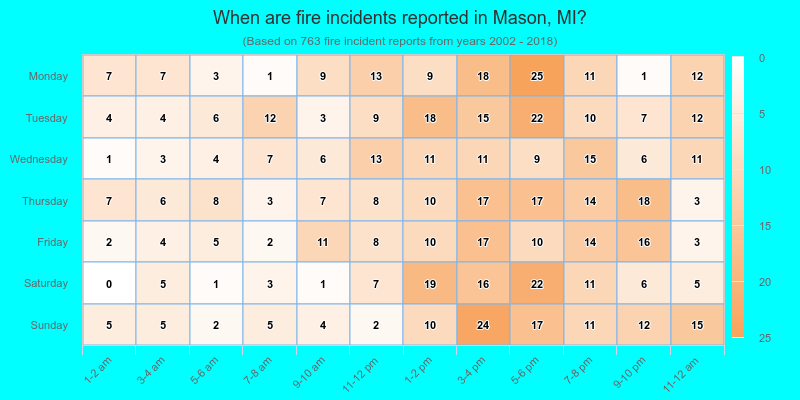
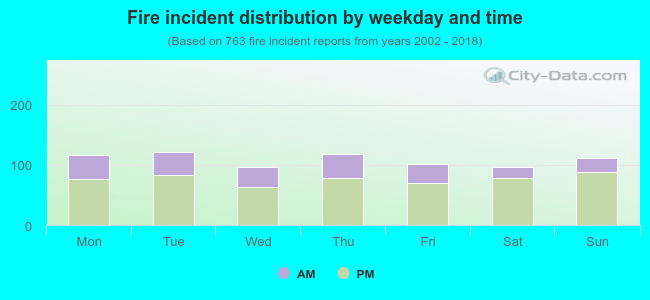 29.2% incidents where reported in the morning and 70.8% in the evening. The most fires (16.0%) took place on Tuesday, and the least (12.6%) on Saturday.
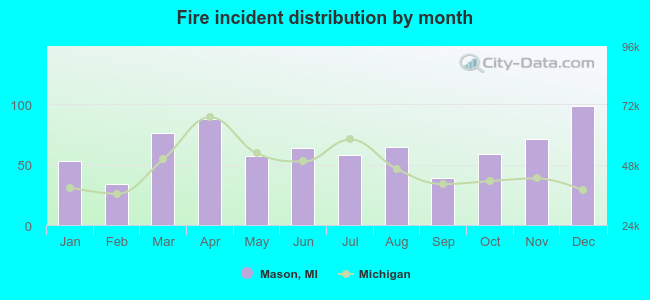 Based on the 763 fire incidents from years 2002 - 2018 most fires (13.0%) took place during December, and the least (4.5%) in February.
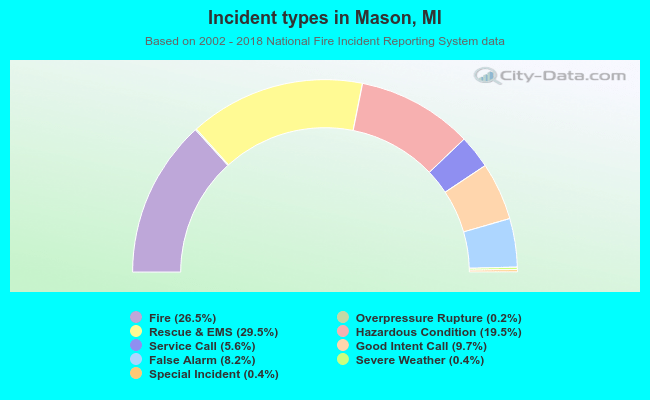 Out of all 2,880 cases reported during the years 2002 - 2018, the most belonged to the categories: Rescue & EMS (29.5%), Fire (26.5%), and Hazardous Condition (19.5%).
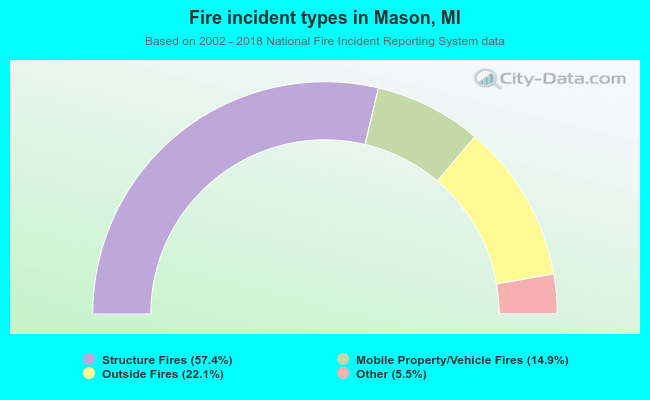 When looking into fire subcategories, the most incidents belonged to: Structure Fires (57.4%), and Outside Fires (22.1%).