Stony Point: Fire Incidents, New York (NY)
Where are fire incidents reported in Stony Point, NY
Something went wrong! Please refresh the page.
|
| |||||||||||||||||||||||||||||||||||||||||||||||||||||||||||||||||||||||||||||||||||||||||||||||||||||||||||||
2002 - 2018 National Fire Incident Reporting System (NFIRS) incidents
- Incident types reported to NFIRS in Stony Point, NY
- 67230.6%Hazardous Condition
- 63528.9%Fire
- 39718.1%False Alarm
- 29313.3%Good Intent Call
- 1074.9%Service Call
- 833.8%Rescue & EMS
- 60.3%Severe Weather
- 30.1%Overpressure Rupture
- Fire incident types reported to NFIRS in Stony Point, NY
- 34454.2%Structure Fires
- 17227.1%Outside Fires
- 10917.2%Mobile Property/Vehicle Fires
- 101.6%Other
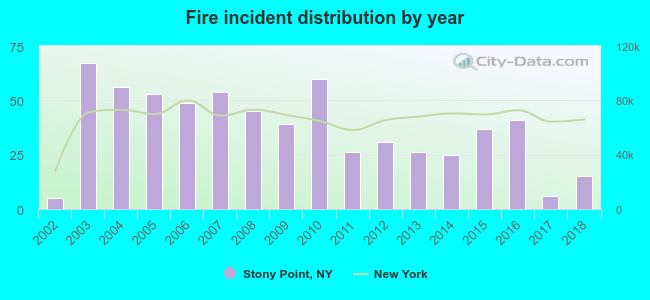 Based on the data from the years 2002 - 2018 the average number of fires per year is 37. The highest number of fire incidents - 67 took place in 2003, and the least - 5 in 2002. The data has a rising trend.
The average number of yearly fire incidents per 10k residents in Stony Point, NY compared to nearest cities:
(Note: Based on data for the last 3 years, including only cities with population 5,000 and above)
| Stony Point: | 17.0 |
| Thiells: | 4.0 |
| West Haverstraw: | 7.4 |
| Haverstraw: | 40.0 |
| Mount Ivy: | 1.5 |
| Cortlandt: | 11.1 |
| New City: | 19.5 |
| Peekskill: | 33.7 |
| Congers: | 31.1 |
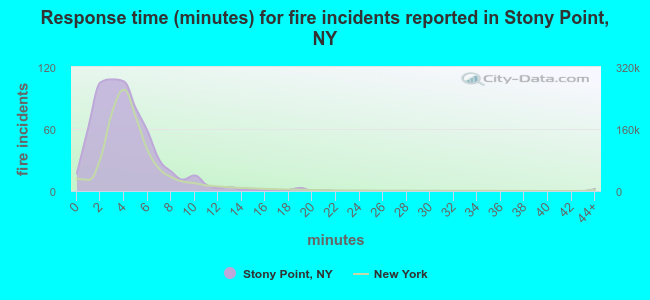 The median response time based on all reported fire incidents is 4 minutes. This is similar to the New York median value.
The median response time in Stony Point, NY compared to nearest cities:
(Note: Based on data for all years, including only cities with at least 500 fire incidents)
| Stony Point: | 4 minutes |
| Pomona: | 5 minutes |
| Cortlandt: | 7 minutes |
| New City: | 4 minutes |
| Peekskill: | 3 minutes |
| Spring Valley: | 5 minutes |
| Monsey: | 0 minutes |
| Nanuet: | 5 minutes |
| Yorktown: | 6 minutes |
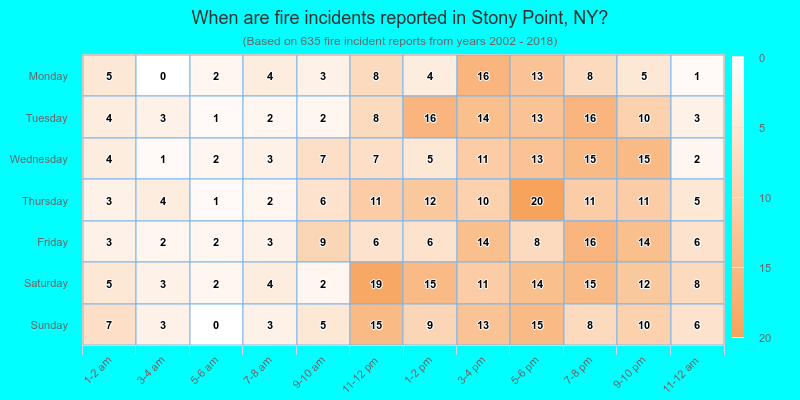
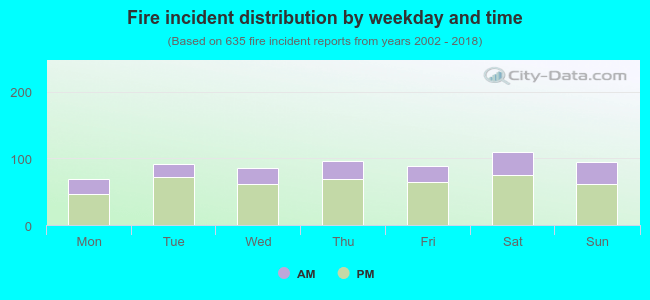 29.3% incidents where reported in the morning and 70.7% in the evening. The most fires (17.3%) took place on Saturday, and the least (10.9%) on Monday.
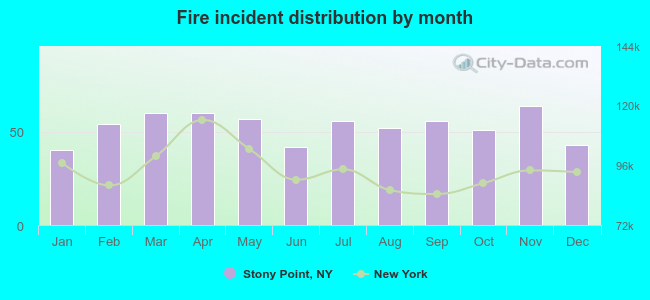 Based on the 635 incident reports from years 2002 - 2018 most fires (10.1%) took place during November, and the least (6.3%) in January.
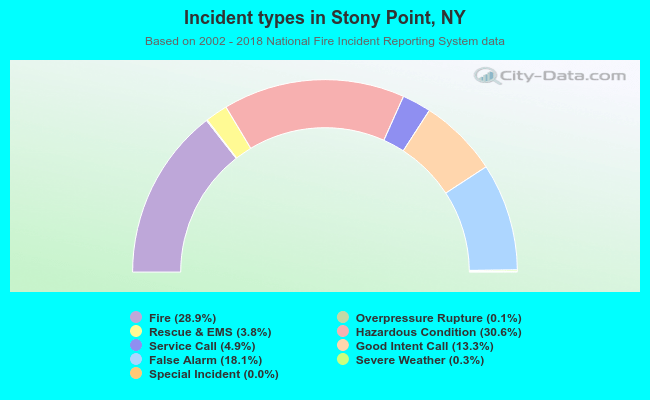 Out of all 2,197 cases reported during the years 2002 - 2018, the most belonged to the categories: Hazardous Condition (30.6%), Fire (28.9%), and False Alarm (18.1%).
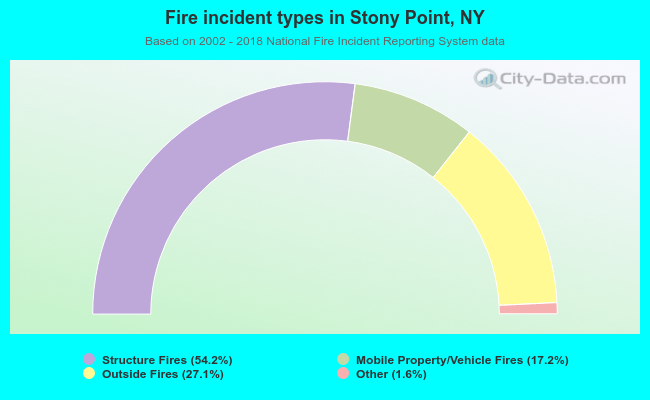 When looking into fire subcategories, the most reports belonged to: Structure Fires (54.2%), and Outside Fires (27.1%).