Homewood: Fire Incidents, Illinois (IL)
Where are fire incidents reported in Homewood, IL
Something went wrong! Please refresh the page.
| Fire incidents reported | |
|---|---|
| Sreet name | Count |
| HALSTED ST | 370 |
| 183RD ST | 198 |
| DIXIE HWY | 120 |
| RIDGE RD | 88 |
| 184TH ST | 52 |
| GOVERNORS HWY | 50 |
| HARWOOD AVE | 50 |
| ELDER RD | 46 |
| MAPLE RD | 46 |
| 175TH ST | 44 |
| WILLOW RD | 44 |
| OLIVE RD | 40 |
| ASHLAND AVE | 36 |
| CHAYES PARK DR | 34 |
| MARTIN AVE | 34 |
| HICKORY RD | 32 |
| 191ST ST | 28 |
| 187TH ST | 26 |
| ABERDEEN ST | 26 |
| HALSTED | 24 |
| LINDEN RD | 22 |
| LOOMIS AVE | 22 |
| 192ND ST | 20 |
| CENTER AVE | 20 |
| HOFFMAN WAY | 20 |
| HEATHER RD | 18 |
| HOOD AVE | 18 |
| RIEGEL RD | 18 |
| STEWART AVE | 18 |
| 186TH ST | 16 |
2002 - 2018 National Fire Incident Reporting System (NFIRS) incidents
- Incident types reported to NFIRS in Homewood, IL
- 12,13464.5%Rescue & EMS
- 2,34112.4%Hazardous Condition
- 1,4137.5%Fire
- 1,3387.1%False Alarm
- 8034.3%Good Intent Call
- 7484.0%Service Call
- 220.1%Overpressure Rupture
- Fire incident types reported to NFIRS in Homewood, IL
- 75953.7%Structure Fires
- 41029.0%Outside Fires
- 18513.1%Mobile Property/Vehicle Fires
- 594.2%Other
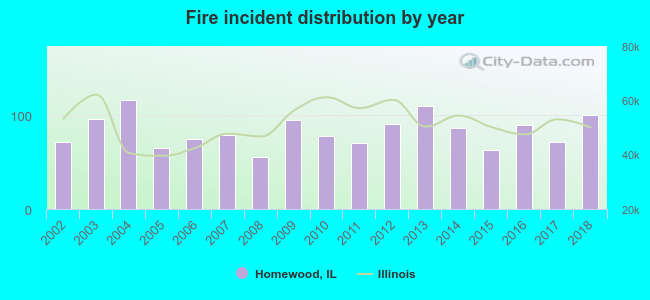 Based on the data from the years 2002 - 2018 the average number of fire incidents per year is 83. The highest number of fire incidents - 116 took place in 2004, and the least - 56 in 2008. The data has a rising trend.
The average number of yearly fire incidents per 10k residents in Homewood, IL compared to nearest cities:
(Note: Based on data for the last 3 years, including only cities with population 5,000 and above)
| Homewood: | 44.9 |
| Hazel Crest: | 57.3 |
| Flossmoor: | 55.0 |
| Glenwood: | 46.1 |
| Country Club Hills: | 63.0 |
| Markham: | 111.1 |
| Olympia Fields: | 19.8 |
| Chicago Heights: | 29.5 |
| Harvey: | 134.0 |
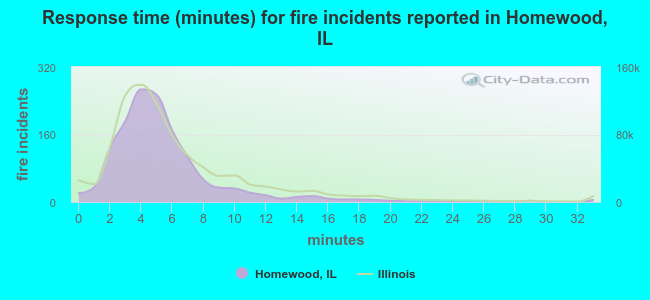 The median response time based on all reported fire incidents is 5 minutes. This is close to the Illinois median value.
The median response time in Homewood, IL compared to nearest cities:
(Note: Based on data for all years, including only cities with at least 500 fire incidents)
| Homewood: | 5 minutes |
| Hazel Crest: | 5 minutes |
| Flossmoor: | 6 minutes |
| Glenwood: | 5 minutes |
| Country Club Hills: | 5 minutes |
| Markham: | 5 minutes |
| Chicago Heights: | 4 minutes |
| Harvey: | 3 minutes |
| South Holland: | 5 minutes |
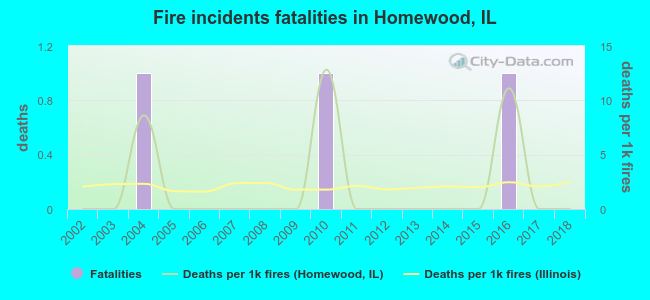 Based on the data from the years 2002 - 2018 the average number of fire-related yearly deaths is 0. The highest number of deaths - 1 took place in 2004, and the lowest - 0 in 2002. The data has a constant trend.
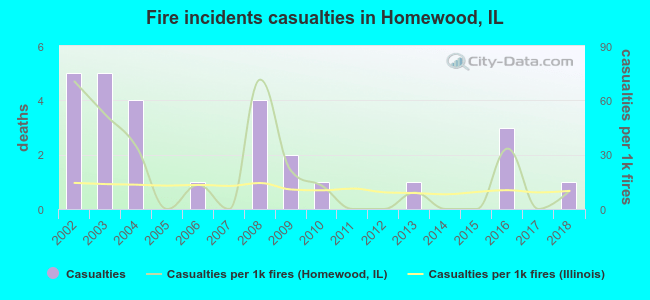 Based on the data from the years 2002 - 2018 the average number of fire-related casualties per year is 2. The highest number of injuries - 5 took place in 2002, and the lowest - 0 in 2005. The data has a dropping trend.
The average number of casualties per 1,000 fire incidents is 19. This indicator was the highest - 71 in 2008, and the lowest 0 in 2005. The trend for injuries per 1,000 fire incidents is declining. Compared to the state value the number of injuries per 1,000 incidents is higher.
Based on the data from the years 2002 - 2018 the average number of fire-related casualties per year is 2. The highest number of injuries - 5 took place in 2002, and the lowest - 0 in 2005. The data has a dropping trend.
The average number of casualties per 1,000 fire incidents is 19. This indicator was the highest - 71 in 2008, and the lowest 0 in 2005. The trend for injuries per 1,000 fire incidents is declining. Compared to the state value the number of injuries per 1,000 incidents is higher.Casualties per 1,000 incidents in Homewood, IL compared to nearest cities:
(Note: Based on data for all years, including only cities with at least 500 fire incidents)
| Homewood: | 19.1 |
| Hazel Crest: | 11.5 |
| Flossmoor: | 17.8 |
| Glenwood: | 3.1 |
| Country Club Hills: | 6.0 |
| Markham: | 0.0 |
| Chicago Heights: | 9.6 |
| Harvey: | 10.1 |
| South Holland: | 22.0 |
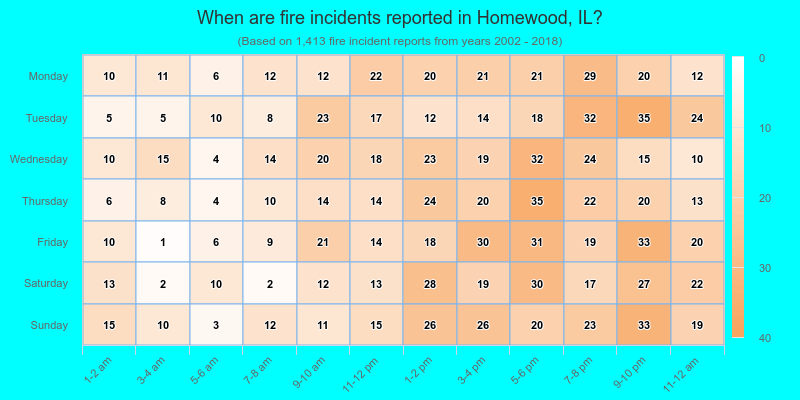
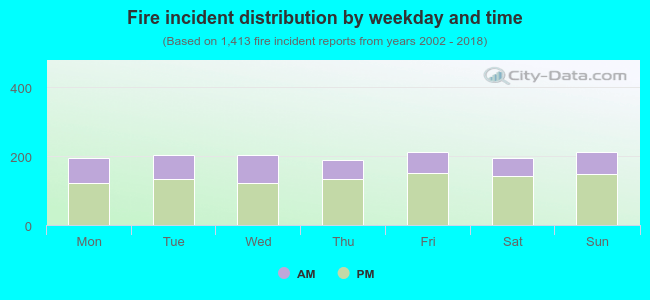 32.3% incidents where reported in the morning and 67.7% in the evening. The most fires (15.1%) took place on Sunday, and the least (13.4%) on Thursday.
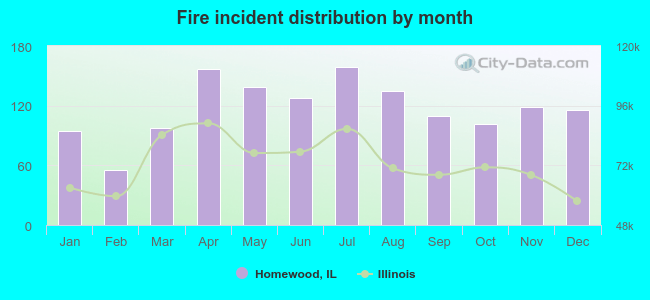 Based on the 1,413 incident reports from years 2002 - 2018 most fires (11.3%) took place during July, and the least (3.9%) in February.
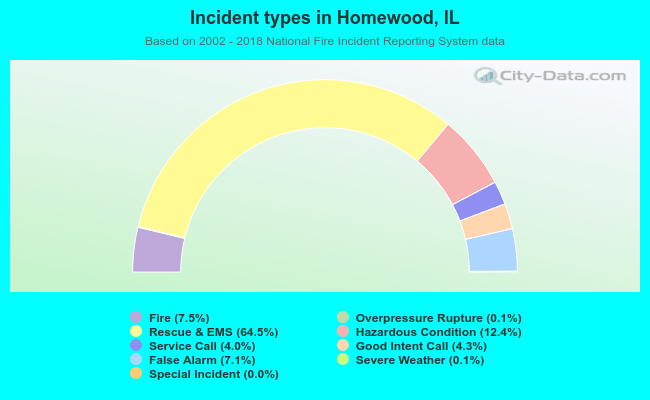 Out of all 18,818 cases reported during the years 2002 - 2018, the most belonged to the categories: Rescue & EMS (64.5%), Hazardous Condition (12.4%), and Fire (7.5%).
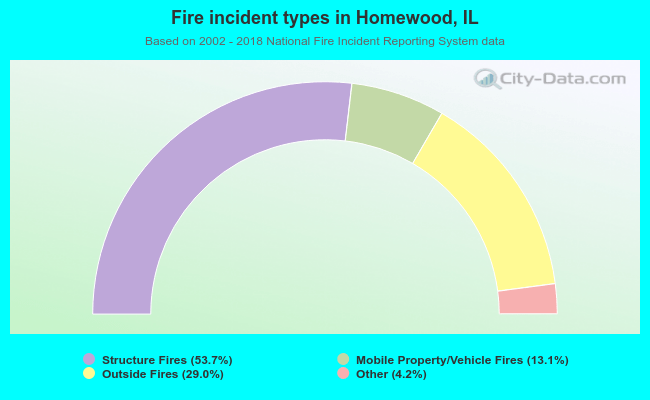 When looking into fire subcategories, the most reports belonged to: Structure Fires (53.7%), and Outside Fires (29.0%).