Glenwood: Fire Incidents, Illinois (IL)
Where are fire incidents reported in Glenwood, IL
Something went wrong! Please refresh the page.
|
| |||||||||||||||||||||||||||||||||||||||||||||||||||||||||||||||||||||||||||||||||||||||||||||||||||||||||||||
2002 - 2018 National Fire Incident Reporting System (NFIRS) incidents
- Incident types reported to NFIRS in Glenwood, IL
- 4,93858.4%Rescue & EMS
- 92711.0%Hazardous Condition
- 90010.6%False Alarm
- 6357.5%Fire
- 6007.1%Service Call
- 4275.1%Good Intent Call
- 130.2%Severe Weather
- 90.1%Special Incident
- Fire incident types reported to NFIRS in Glenwood, IL
- 32651.3%Structure Fires
- 15223.9%Outside Fires
- 13421.1%Mobile Property/Vehicle Fires
- 233.6%Other
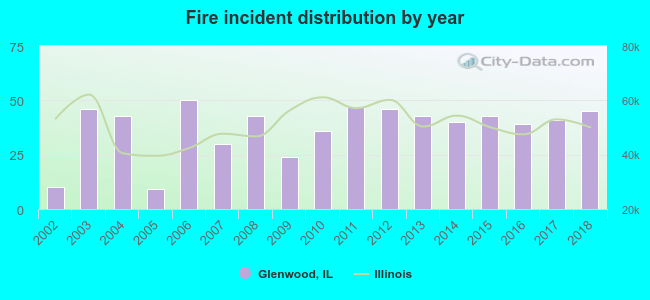 Based on the data from the years 2002 - 2018 the average number of fires per year is 37. The highest number of fires - 50 took place in 2006, and the least - 9 in 2005. The data has a growing trend.
The average number of yearly fire incidents per 10k residents in Glenwood, IL compared to nearest cities:
(Note: Based on data for the last 3 years, including only cities with population 5,000 and above)
| Glenwood: | 46.1 |
| Chicago Heights: | 29.5 |
| Homewood: | 44.9 |
| Lynwood: | 23.3 |
| South Holland: | 57.7 |
| Lansing: | 37.2 |
| Flossmoor: | 55.0 |
| Hazel Crest: | 57.3 |
| Olympia Fields: | 19.8 |
 The median response time based on all reported fire incidents is 5 minutes. This is about the same as the state median value.
The median response time in Glenwood, IL compared to nearest cities:
(Note: Based on data for all years, including only cities with at least 500 fire incidents)
| Glenwood: | 5 minutes |
| Chicago Heights: | 4 minutes |
| Homewood: | 5 minutes |
| South Holland: | 5 minutes |
| Lansing: | 3 minutes |
| Flossmoor: | 6 minutes |
| Hazel Crest: | 5 minutes |
| Sauk Village: | 8 minutes |
| Harvey: | 3 minutes |
 According to the data from the years 2002 - 2018 the average number of fire-related yearly deaths is 0. The highest number of reported deaths - 2 took place in 2006, and the lowest - 0 in 2002. The data has a constant trend.
 33.7% incidents where reported in the morning and 66.3% in the evening. The most fires (16.1%) took place on Thursday, and the least (12.3%) on Saturday.
 According to the 635 fire incidents from years 2002 - 2018 most fires (10.1%) took place during May, and the least (5.7%) in September.
 Out of all 8,451 cases reported during the years 2002 - 2018, the most belonged to the categories: Rescue & EMS (58.4%), Hazardous Condition (11.0%), and False Alarm (10.6%).
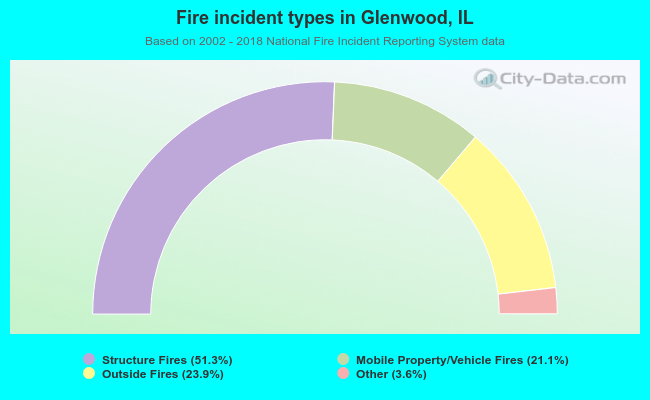 When looking into fire subcategories, the most reports belonged to: Structure Fires (51.3%), and Outside Fires (23.9%).