Hopatcong: Fire Incidents, New Jersey (NJ)
Where are fire incidents reported in Hopatcong, NJ
Something went wrong! Please refresh the page.
|
| |||||||||||||||||||||||||||||||||||||||||||||||||||||||||||||||||||||||||||||||||||||||||||||||||||||||||||||
2002 - 2018 National Fire Incident Reporting System (NFIRS) incidents
- Incident types reported to NFIRS in Hopatcong, NJ
- 27245.3%Fire
- 15025.0%Hazardous Condition
- 10116.8%False Alarm
- 274.5%Service Call
- 233.8%Rescue & EMS
- 223.7%Good Intent Call
- 50.8%Special Incident
- Fire incident types reported to NFIRS in Hopatcong, NJ
- 19170.2%Structure Fires
- 4215.4%Outside Fires
- 228.1%Other
- 176.3%Mobile Property/Vehicle Fires
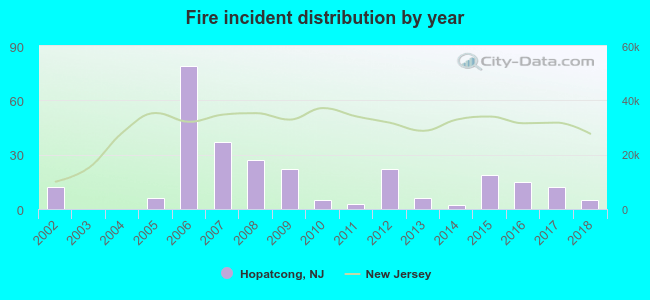 According to the data from the years 2002 - 2018 the average number of fire incidents per year is 16. The highest number of reported fires - 79 took place in 2006, and the least - 0 in 2003. The data has a dropping trend.
The average number of yearly fire incidents per 10k residents in Hopatcong, NJ compared to nearest cities:
(Note: Based on data for the last 3 years, including only cities with population 5,000 and above)
| Hopatcong: | 7.3 |
| Mount Arlington: | 23.7 |
| Succasunna: | 19.3 |
| Wharton: | 24.2 |
| Budd Lake: | 78.4 |
| Dover: | 64.8 |
| Rockaway: | 57.6 |
| Newton: | 20.3 |
| Hackettstown: | 32.5 |
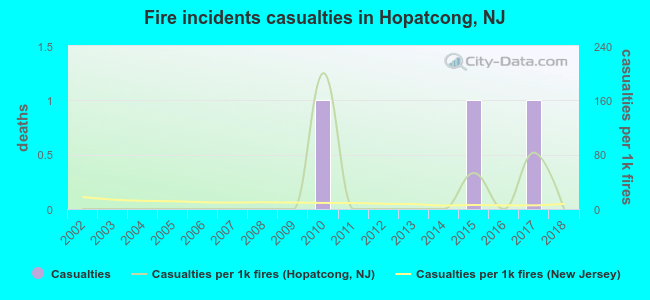 Based on the data from the years 2002 - 2018 the average number of fire-related yearly casualties is 0. The highest number of reported casualties - 1 took place in 2010, and the lowest - 0 in 2002. The data has a constant trend.
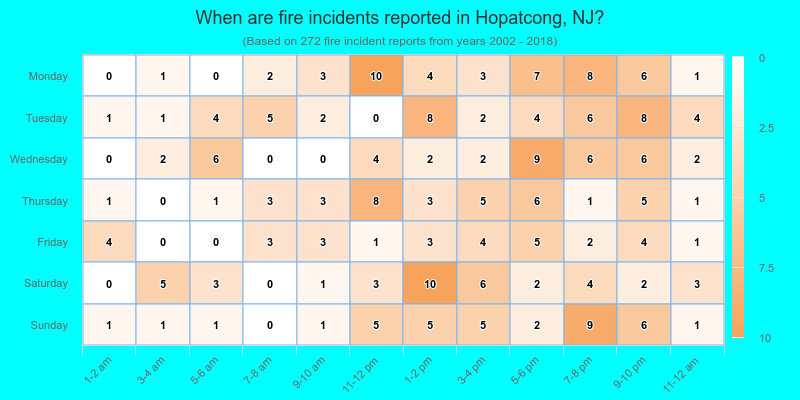
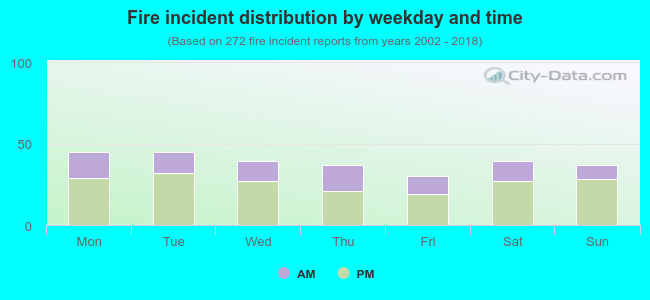 32.7% incidents where reported in the morning and 67.3% in the evening. The most fires (16.5%) took place on Monday, and the least (11.0%) on Friday.
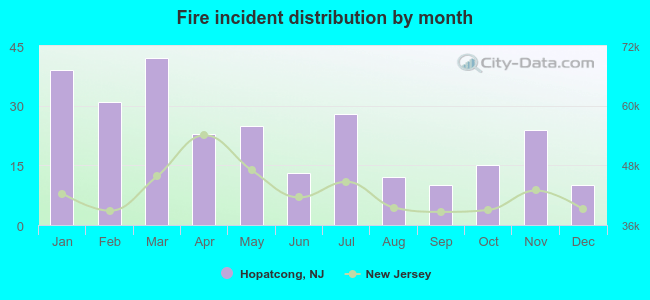 According to the 272 fire incidents from years 2002 - 2018 most fires (15.4%) took place during March, and the least (3.7%) in September.
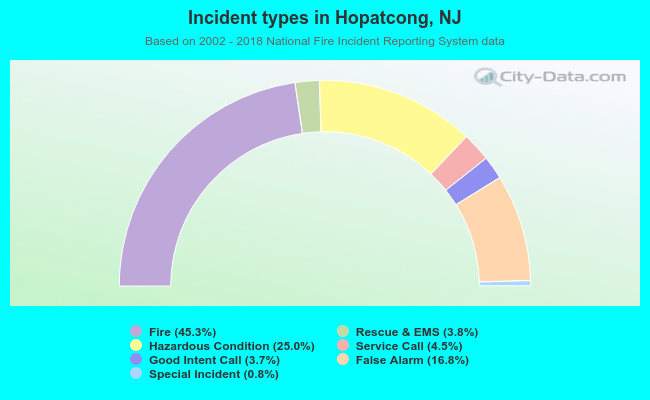 Out of all 600 cases reported during the years 2002 - 2018, the most belonged to the categories: Fire (45.3%), Rescue & EMS (25.0%), and Good Intent Call (16.8%).
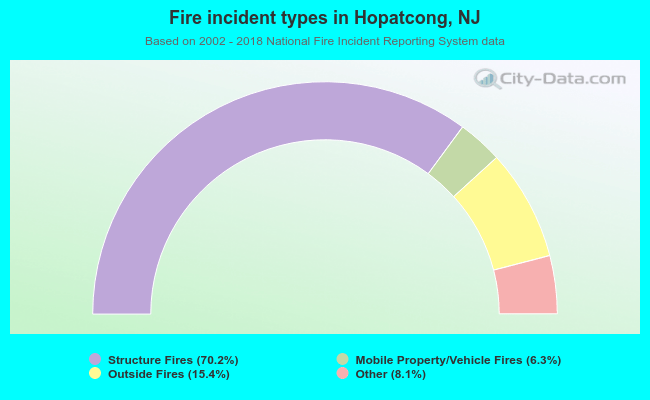 When looking into fire subcategories, the most incidents belonged to: Structure Fires (70.2%), and Outside Fires (15.4%).