Mount Arlington: Fire Incidents, New Jersey (NJ)
Where are fire incidents reported in Mount Arlington, NJ
Something went wrong! Please refresh the page.
|
| |||||||||||||||||||||||||||||||||||||||||||||||||||||||||||||||||||||||||||||||||||||||||||||||||||||||||||||
2002 - 2018 National Fire Incident Reporting System (NFIRS) incidents
- Incident types reported to NFIRS in Mount Arlington, NJ
- 23627.3%Hazardous Condition
- 21224.5%False Alarm
- 20123.2%Fire
- 9310.8%Rescue & EMS
- 687.9%Good Intent Call
- 435.0%Service Call
- 70.8%Severe Weather
- 30.3%Overpressure Rupture
- 20.2%Special Incident
- Fire incident types reported to NFIRS in Mount Arlington, NJ
- 9044.8%Structure Fires
- 4120.4%Outside Fires
- 3919.4%Mobile Property/Vehicle Fires
- 3115.4%Other
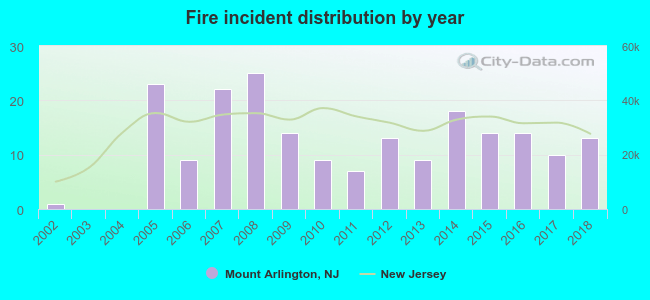 Based on the data from the years 2002 - 2018 the average number of fires per year is 12. The highest number of fire incidents - 25 took place in 2008, and the least - 0 in 2003. The data has a growing trend.
The average number of yearly fire incidents per 10k residents in Mount Arlington, NJ compared to nearest cities:
(Note: Based on data for the last 3 years, including only cities with population 5,000 and above)
| Mount Arlington: | 23.7 |
| Hopatcong: | 7.3 |
| Succasunna: | 19.3 |
| Wharton: | 24.2 |
| Dover: | 64.8 |
| Budd Lake: | 78.4 |
| Rockaway: | 57.6 |
| Morris Plains: | 79.7 |
| Hackettstown: | 32.5 |

 33.3% incidents where reported in the morning and 66.7% in the evening. The most fires (19.4%) took place on Monday, and the least (9.5%) on Tuesday.
 According to the 201 incident reports from years 2002 - 2018 most fires (14.9%) took place during April, and the least (4.0%) in August.
 Out of all 865 cases reported during the years 2002 - 2018, the most belonged to the categories: Hazardous Condition (27.3%), False Alarm (24.5%), and Fire (23.2%).
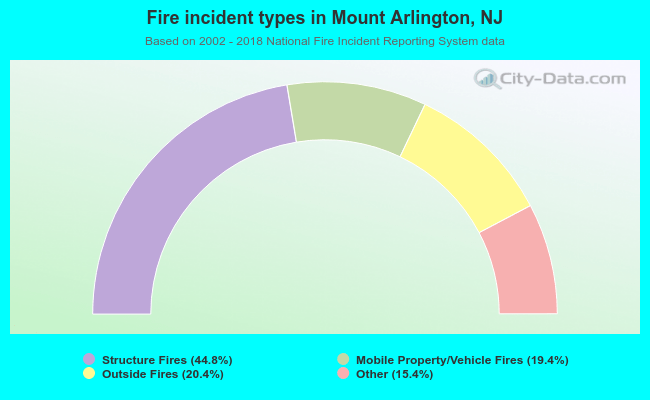 When looking into fire subcategories, the most incidents belonged to: Structure Fires (44.8%), and Outside Fires (20.4%).