Succasunna: Fire Incidents, New Jersey (NJ)
Where are fire incidents reported in Succasunna, NJ
Something went wrong! Please refresh the page.
|
| |||||||||||||||||||||||||||||||||||||||||||||||||||||||||||||||||||||||||||||||||||||||||||||||||||||||||||||
2002 - 2018 National Fire Incident Reporting System (NFIRS) incidents
- Incident types reported to NFIRS in Succasunna, NJ
- 38933.0%False Alarm
- 29424.9%Hazardous Condition
- 18815.9%Rescue & EMS
- 14011.9%Fire
- 11810.0%Good Intent Call
- 383.2%Service Call
- 80.7%Special Incident
- 30.3%Overpressure Rupture
- Fire incident types reported to NFIRS in Succasunna, NJ
- 6244.3%Outside Fires
- 5942.1%Structure Fires
- 1712.1%Mobile Property/Vehicle Fires
- 21.4%Other
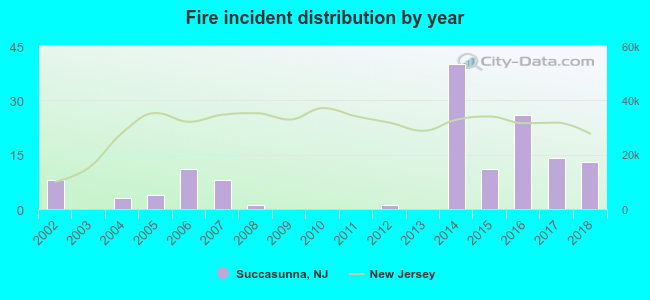 Based on the data from the years 2002 - 2018 the average number of fire incidents per year is 8. The highest number of fires - 40 took place in 2014, and the least - 0 in 2003. The data has a rising trend.
The average number of yearly fire incidents per 10k residents in Succasunna, NJ compared to nearest cities:
(Note: Based on data for the last 3 years, including only cities with population 5,000 and above)
| Succasunna: | 19.3 |
| Mount Arlington: | 23.7 |
| Wharton: | 24.2 |
| Dover: | 64.8 |
| Hopatcong: | 7.3 |
| Budd Lake: | 78.4 |
| Rockaway: | 57.6 |
| Morris Plains: | 79.7 |
| Morristown: | 43.7 |
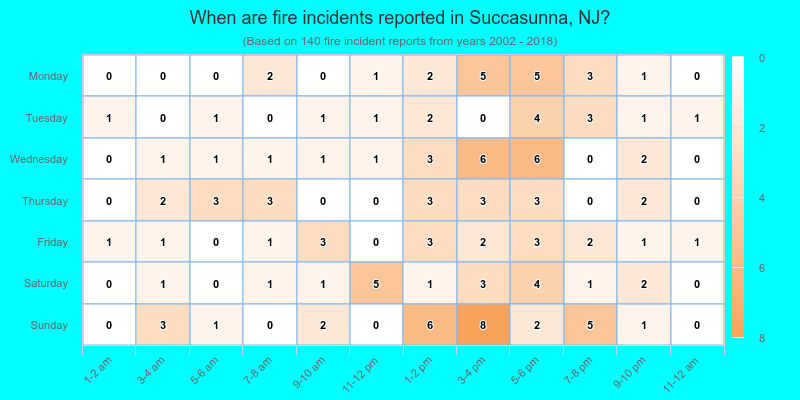
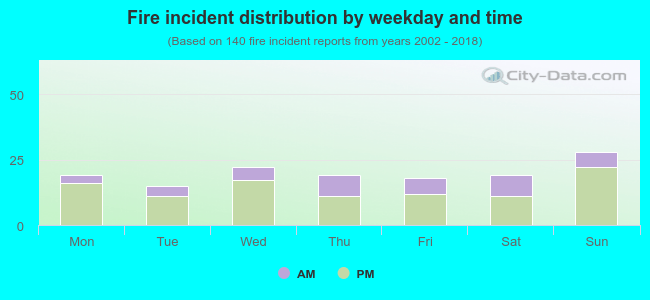 28.6% incidents where reported in the morning and 71.4% in the evening. The most fires (20.0%) took place on Sunday, and the least (10.7%) on Tuesday.
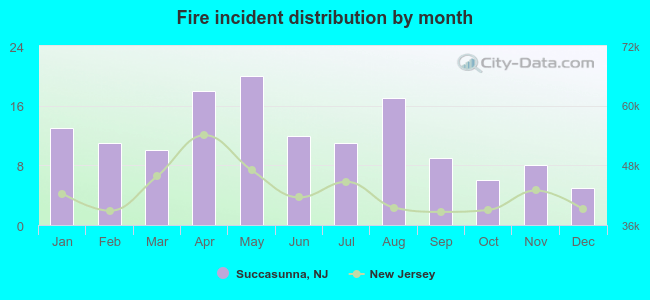 Based on the 140 incident reports from years 2002 - 2018 most fires (14.3%) took place during May, and the least (3.6%) in December.
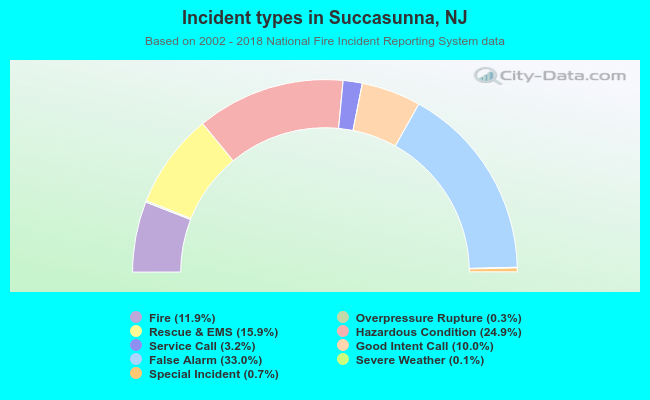 Out of all 1,179 cases reported during the years 2002 - 2018, the most belonged to the categories: False Alarm (33.0%), Hazardous Condition (24.9%), and Rescue & EMS (15.9%).
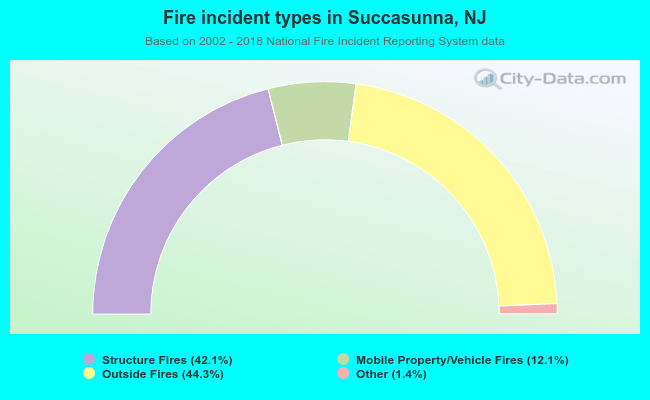 When looking into fire subcategories, the most reports belonged to: Outside Fires (44.3%), and Structure Fires (42.1%).