Hopkinsville: Fire Incidents, Kentucky (KY)
Where are fire incidents reported in Hopkinsville, KY
Something went wrong! Please refresh the page.
| Fire incidents reported | |
|---|---|
| Sreet name | Count |
| FT CAMPBELL BLVD | 170 |
| 7TH ST | 108 |
| MAIN ST | 70 |
| BILL BRYAN BLVD | 46 |
| DENZIL DR | 44 |
| VIRGINIA ST | 44 |
| 9TH ST | 36 |
| BUTLER RD | 36 |
| GREENVILLE RD | 34 |
| PEMBROKE RD | 34 |
| 1ST ST | 32 |
| GREENVILLE ROAD | 32 |
| 18TH ST | 30 |
| FRANK YOST LN | 30 |
| COUNTRY CLUB LN | 28 |
| COX MILL RD | 28 |
| LAFAYETTE RD | 28 |
| RICHARD ST | 24 |
| CALVIN DR | 22 |
| CANTON PKE | 22 |
| JULIEN ROAD | 22 |
| KOFFMAN DR | 22 |
| NEWSTEAD ROAD | 22 |
| OLD MADISONVILLE RD | 22 |
| 4TH ST | 20 |
| PRINCETON RD | 20 |
| SANDERSON DR | 20 |
| WALNUT ST | 20 |
| DAWSON SPRINGS RD | 18 |
| FLORENCE ST | 18 |
| Other | 1,028 |
2003 - 2018 National Fire Incident Reporting System (NFIRS) incidents
- Incident types reported to NFIRS in Hopkinsville, KY
- 7,08157.4%Rescue & EMS
- 2,13017.3%Fire
- 9527.7%Service Call
- 8096.6%Hazardous Condition
- 7736.3%False Alarm
- 5174.2%Good Intent Call
- 390.3%Overpressure Rupture
- 220.2%Special Incident
- 140.1%Severe Weather
- Fire incident types reported to NFIRS in Hopkinsville, KY
- 79537.3%Outside Fires
- 71533.6%Structure Fires
- 39018.3%Mobile Property/Vehicle Fires
- 23010.8%Other
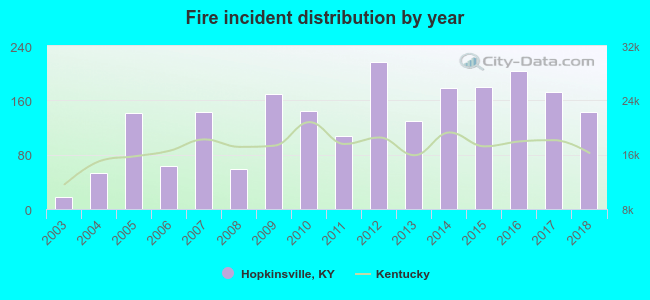 According to the data from the years 2003 - 2018 the average number of fires per year is 133. The highest number of reported fire incidents - 217 took place in 2012, and the least - 18 in 2003. The data has a growing trend.
The average number of yearly fire incidents per 10k residents in Hopkinsville, KY compared to nearest cities:
(Note: Based on data for the last 3 years, including only cities with population 5,000 and above)
| Hopkinsville: | 52.9 |
| Oak Grove: | 60.3 |
| Princeton: | 50.0 |
| Russellville: | 86.2 |
| Madisonville: | 72.7 |
| Central City: | 99.5 |
| Fairdealing: | 1.6 |
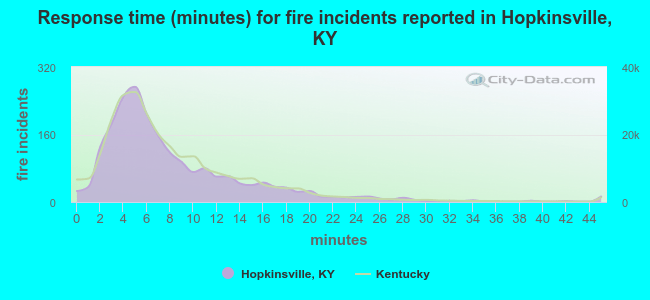 The median response time based on all reported fire incidents is 6 minutes. This is comparable to the state median value.
The median response time in Hopkinsville, KY compared to nearest cities:
(Note: Based on data for all years, including only cities with at least 500 fire incidents)
| Hopkinsville: | 6 minutes |
| Oak Grove: | 7 minutes |
| Cadiz: | 13 minutes |
| Greenville: | 11 minutes |
| Russellville: | 5 minutes |
| Madisonville: | 5 minutes |
| Central City: | 8 minutes |
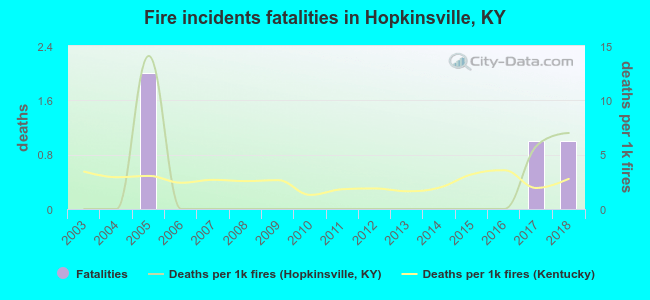 According to the data from the years 2003 - 2018 the average number of fire-related fatalities per year is 0. The highest number of reported deaths - 2 took place in 2005, and the lowest - 0 in 2003. The data has a rising trend.
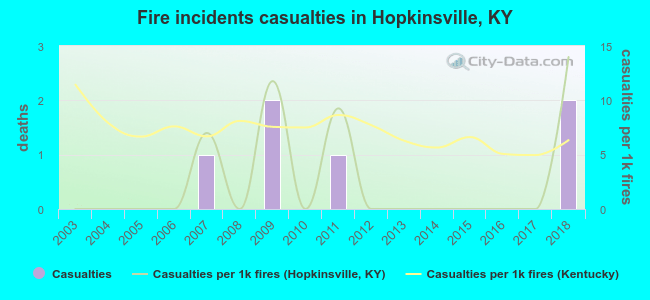 According to the reports from the years 2003 - 2018 the average number of fire-related casualties per year is 0. The highest number of reported casualties - 2 took place in 2009, and the lowest - 0 in 2003. The data has a growing trend.
The average number of injuries per 1,000 fire incidents is 3. This indicator was the highest - 14 in 2018, and the lowest 0 in 2003. The trend for injuries per 1,000 fire incidents is increasing. Compared to the state value the number of injuries per 1,000 fires is much lower.
According to the reports from the years 2003 - 2018 the average number of fire-related casualties per year is 0. The highest number of reported casualties - 2 took place in 2009, and the lowest - 0 in 2003. The data has a growing trend.
The average number of injuries per 1,000 fire incidents is 3. This indicator was the highest - 14 in 2018, and the lowest 0 in 2003. The trend for injuries per 1,000 fire incidents is increasing. Compared to the state value the number of injuries per 1,000 fires is much lower.Casualties per 1,000 incidents in Hopkinsville, KY compared to nearest cities:
(Note: Based on data for all years, including only cities with at least 500 fire incidents)
| Hopkinsville: | 2.8 |
| Oak Grove: | 2.5 |
| Cadiz: | 7.8 |
| Greenville: | 0.0 |
| Russellville: | 1.0 |
| Madisonville: | 1.4 |
| Central City: | 3.7 |
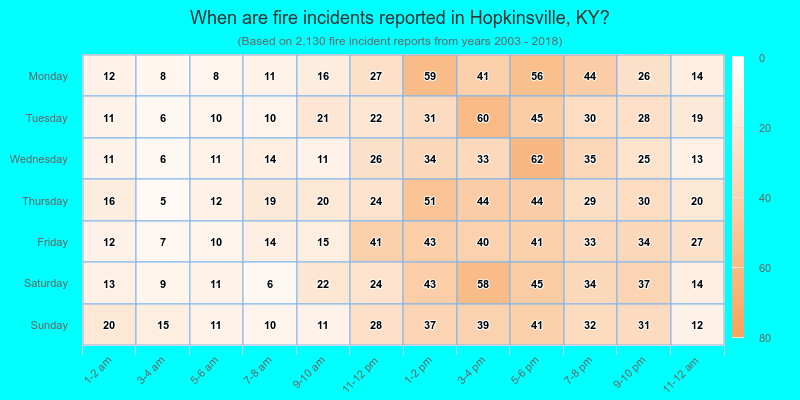
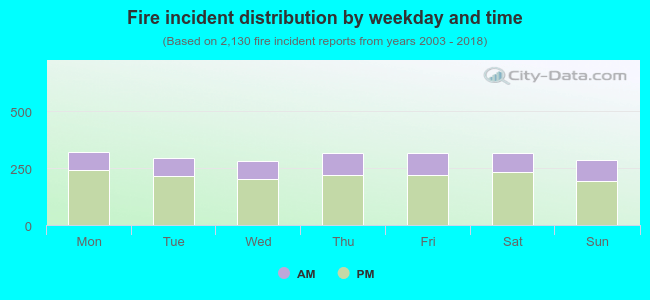 28.9% incidents where reported in the morning and 71.1% in the evening. The most fires (15.1%) took place on Monday, and the least (13.2%) on Wednesday.
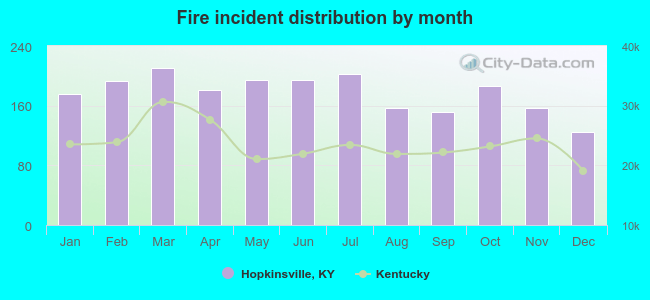 According to the 2,130 fire incident reports from years 2003 - 2018 most fires (9.9%) took place during March, and the least (5.9%) in December.
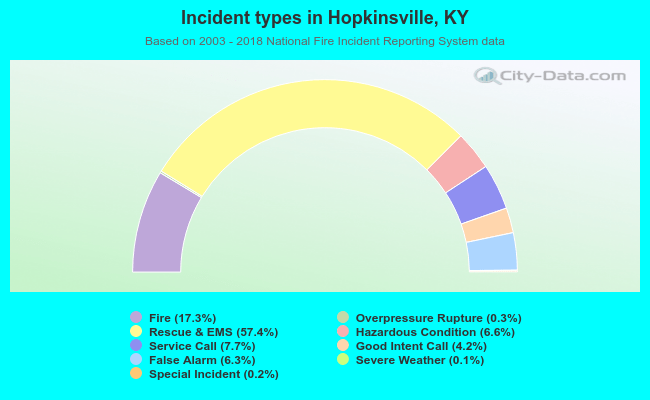 Out of all 12,337 cases reported during the years 2003 - 2018, the most belonged to the categories: Rescue & EMS (57.4%), Fire (17.3%), and Service Call (7.7%).
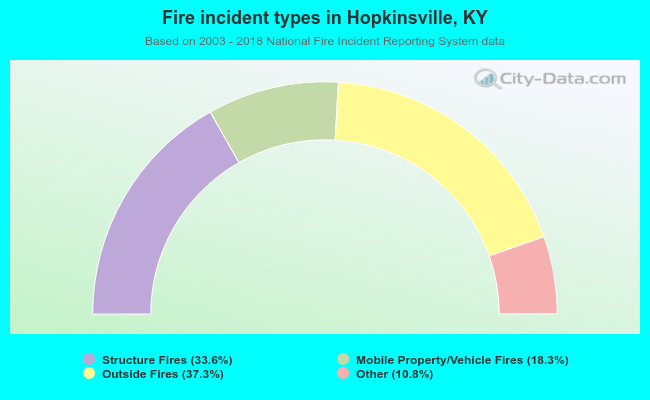 When looking into fire subcategories, the most reports belonged to: Outside Fires (37.3%), and Structure Fires (33.6%).