Madisonville: Fire Incidents, Kentucky (KY)
Where are fire incidents reported in Madisonville, KY
Something went wrong! Please refresh the page.
| Fire incidents reported | |
|---|---|
| Sreet name | Count |
| MAIN ST | 230 |
| CENTER ST | 98 |
| ANTON RD | 90 |
| NOEL AVE | 70 |
| ISLAND FORD RD | 60 |
| GRAPEVINE RD | 56 |
| BROWN RD | 44 |
| BROADWAY ST | 40 |
| BEULAH ROAD | 34 |
| KENTUCKY AVE | 34 |
| NEBO RD | 34 |
| HANSON RD | 30 |
| STAGECOACH RD | 30 |
| BALDWIN DR | 28 |
| EASTSIDE LN | 28 |
| HALL ST | 28 |
| PARK AVE | 28 |
| ARCH ST | 26 |
| BROADWAY | 26 |
| MADISON AVE | 26 |
| PRIDE AVE | 26 |
| MURRAY ST | 24 |
| PENNYRILE PKY | 24 |
| PRINCETON RD | 24 |
| PENNYRILE PARKWAY | 22 |
| SCOTT ST | 22 |
| CENTRAL CITY RD | 20 |
| DULIN ST | 20 |
| MADISON SQUARE DR | 20 |
| MCCOY AVE | 20 |
| Other | 904 |
2002 - 2018 National Fire Incident Reporting System (NFIRS) incidents
- Incident types reported to NFIRS in Madisonville, KY
- 3,90151.5%Rescue & EMS
- 2,16628.6%Fire
- 5347.1%False Alarm
- 4666.2%Hazardous Condition
- 2963.9%Good Intent Call
- 1672.2%Service Call
- 170.2%Overpressure Rupture
- 160.2%Severe Weather
- Fire incident types reported to NFIRS in Madisonville, KY
- 83638.6%Structure Fires
- 76935.5%Outside Fires
- 35116.2%Mobile Property/Vehicle Fires
- 2109.7%Other
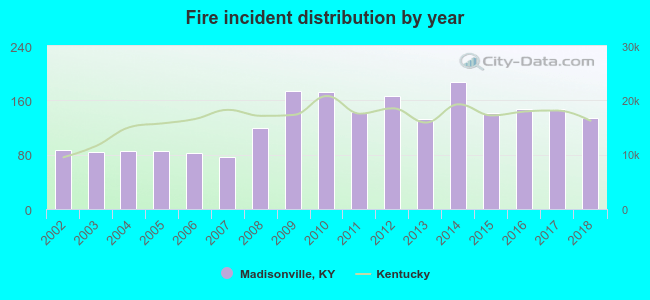 According to the data from the years 2002 - 2018 the average number of fires per year is 127. The highest number of fires - 187 took place in 2014, and the least - 77 in 2007. The data has a rising trend.
The average number of yearly fire incidents per 10k residents in Madisonville, KY compared to nearest cities:
(Note: Based on data for the last 3 years, including only cities with population 5,000 and above)
| Madisonville: | 72.7 |
| Central City: | 99.5 |
| Princeton: | 50.0 |
| Hopkinsville: | 52.9 |
| Henderson: | 55.7 |
| Spottsville: | 5.4 |
| Owensboro: | 74.6 |
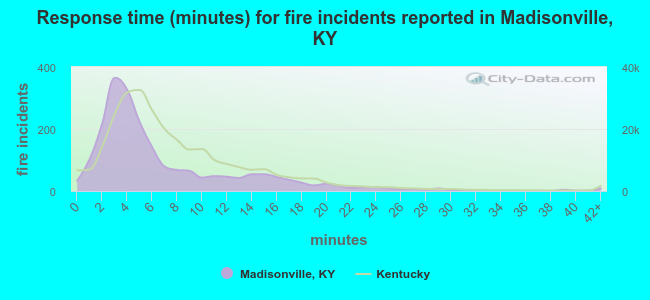 The median response time based on all reported fire incidents is 5 minutes. This is lower compared to the Kentucky median value.
The median response time in Madisonville, KY compared to nearest cities:
(Note: Based on data for all years, including only cities with at least 500 fire incidents)
| Madisonville: | 5 minutes |
| Greenville: | 11 minutes |
| Central City: | 8 minutes |
| Hopkinsville: | 6 minutes |
| Henderson: | 4 minutes |
| Owensboro: | 5 minutes |
| Cadiz: | 13 minutes |
| Newburgh: | 7 minutes |
| Evansville: | 4 minutes |
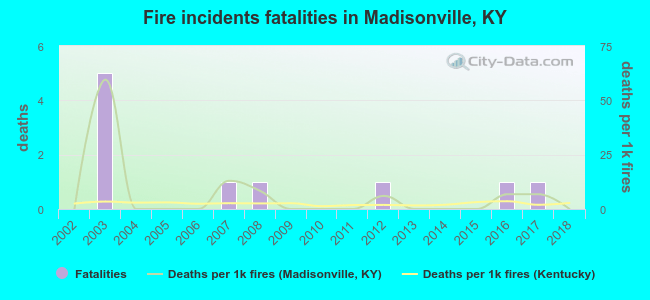 Based on the data from the years 2002 - 2018 the average number of fire-related yearly deaths is 1. The highest number of reported deaths - 5 took place in 2003, and the lowest - 0 in 2002. The data has a constant trend.
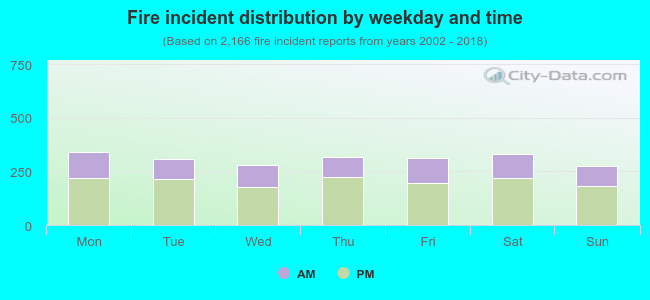 33.8% incidents where reported in the morning and 66.2% in the evening. The most fires (15.8%) took place on Monday, and the least (12.7%) on Sunday.
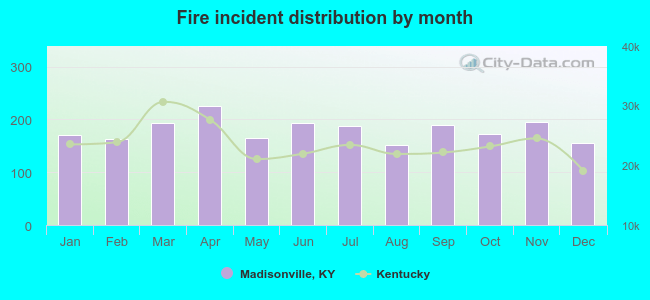 According to the 2,166 fire incident reports from years 2002 - 2018 most fires (10.4%) took place during April, and the least (7.0%) in August.
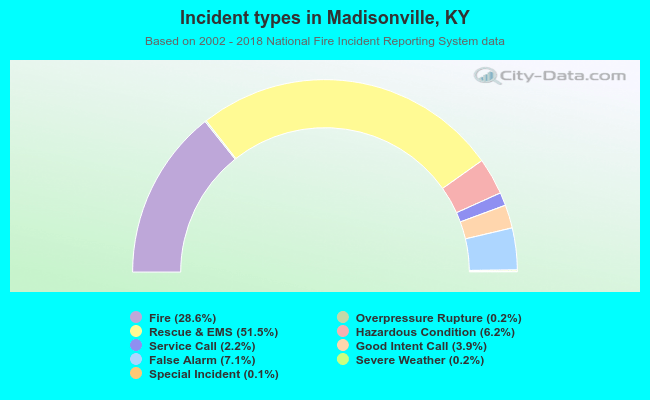 Out of all 7,570 cases reported during the years 2002 - 2018, the most belonged to the categories: Rescue & EMS (51.5%), Fire (28.6%), and False Alarm (7.1%).
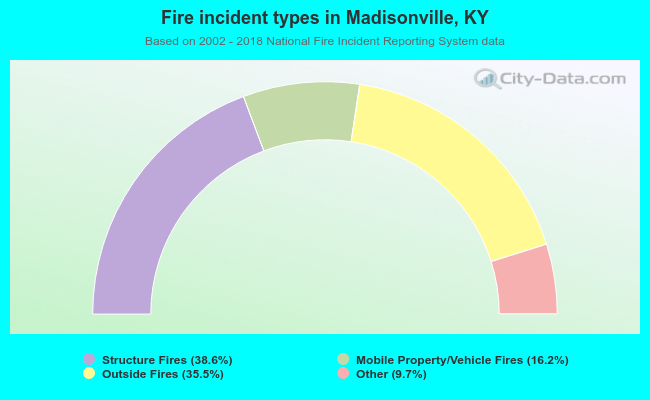 When looking into fire subcategories, the most incidents belonged to: Structure Fires (38.6%), and Outside Fires (35.5%).