Hudson: Fire Incidents, New Hampshire (NH)
Where are fire incidents reported in Hudson, NH
Something went wrong! Please refresh the page.
| Fire incidents reported | |
|---|---|
| Sreet name | Count |
| LOWELL RD | 104 |
| CENTRAL ST | 40 |
| DERRY ST | 38 |
| WASON RD | 30 |
| LIBRARY ST | 28 |
| ROBINSON RD | 26 |
| DERRY RD | 22 |
| FERRY ST | 22 |
| KIMBALL HILL RD | 20 |
| MELENDY RD | 20 |
| PELHAM RD | 18 |
| BARRETTS HILL RD | 16 |
| BOYD RD | 16 |
| GREELEY ST | 16 |
| MOBILE DR | 16 |
| WALL ST | 16 |
| BUSH HILL RD | 14 |
| DRACUT RD | 14 |
| OLD DERRY RD | 14 |
| ROOSEVELT AVE | 14 |
| HIGHLAND ST | 12 |
| MUSQUASH RD | 12 |
| RIVER RD | 12 |
| WINDHAM RD | 12 |
| B ST | 10 |
| BURNS HILL RD | 10 |
| DAVID DR | 10 |
| ELMWOOD DR | 10 |
| FLYING ROCK RD | 10 |
| RANGERS DR | 10 |
| Other | 62 |
2003 - 2018 National Fire Incident Reporting System (NFIRS) incidents
- Incident types reported to NFIRS in Hudson, NH
- 8,98556.4%Rescue & EMS
- 2,24514.1%Hazardous Condition
- 1,85111.6%Service Call
- 1,1497.2%False Alarm
- 8705.5%Good Intent Call
- 6744.2%Fire
- 1010.6%Severe Weather
- 290.2%Special Incident
- 220.1%Overpressure Rupture
- Fire incident types reported to NFIRS in Hudson, NH
- 29543.8%Structure Fires
- 22433.2%Outside Fires
- 9914.7%Mobile Property/Vehicle Fires
- 568.3%Other
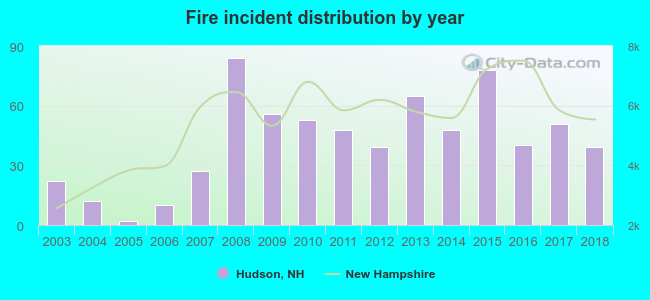 Based on the data from the years 2003 - 2018 the average number of fires per year is 42. The highest number of reported fires - 84 took place in 2008, and the least - 2 in 2005. The data has an increasing trend.
The average number of yearly fire incidents per 10k residents in Hudson, NH compared to nearest cities:
(Note: Based on data for the last 3 years, including only cities with population 5,000 and above)
| Hudson: | 59.1 |
| Nashua: | 30.6 |
| Pelham: | 37.0 |
| Litchfield: | 33.5 |
| Londonderry: | 72.8 |
| Windham: | 29.7 |
| Hollis: | 26.0 |
| Merrimack: | 28.8 |
| Derry: | 46.6 |
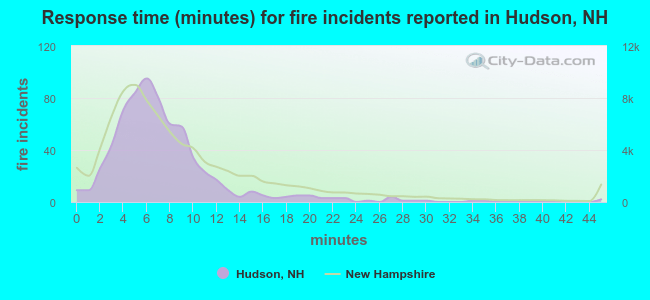 The median response time based on all reported fire incidents is 6 minutes. This is similar to the state median value.
The median response time in Hudson, NH compared to nearest cities:
(Note: Based on data for all years, including only cities with at least 500 fire incidents)
| Hudson: | 6 minutes |
| Nashua: | 6 minutes |
| Pelham: | 8 minutes |
| Londonderry: | 6 minutes |
| Windham: | 9 minutes |
| Merrimack: | 6 minutes |
| Dracut: | 5 minutes |
| Pepperell: | 4 minutes |
| Lowell: | 3 minutes |
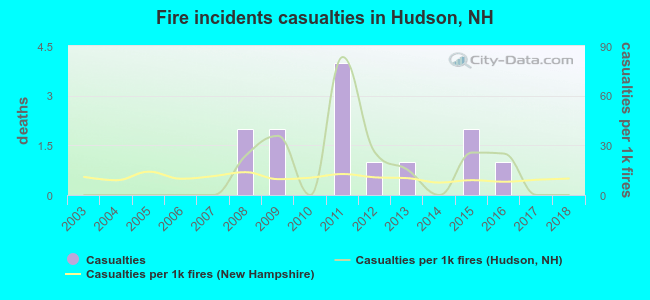 Based on the reports from the years 2003 - 2018 the average number of fire-related yearly casualties is 1. The highest number of reported injuries - 4 took place in 2011, and the lowest - 0 in 2003. The data has a constant trend.
The average number of injuries per 1,000 fire incidents is 15. This indicator was the highest - 83 in 2011, and the lowest 0 in 2003. The trend for injuries per 1,000 fires is dropping. Compared to the state value the number of injuries per 1,000 fires is higher.
Based on the reports from the years 2003 - 2018 the average number of fire-related yearly casualties is 1. The highest number of reported injuries - 4 took place in 2011, and the lowest - 0 in 2003. The data has a constant trend.
The average number of injuries per 1,000 fire incidents is 15. This indicator was the highest - 83 in 2011, and the lowest 0 in 2003. The trend for injuries per 1,000 fires is dropping. Compared to the state value the number of injuries per 1,000 fires is higher.
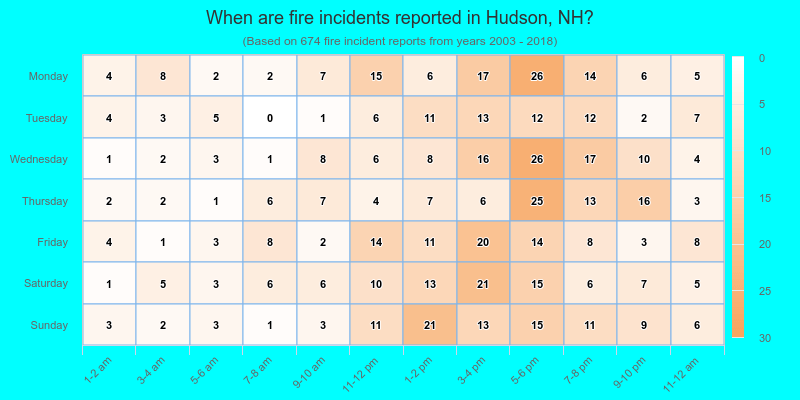
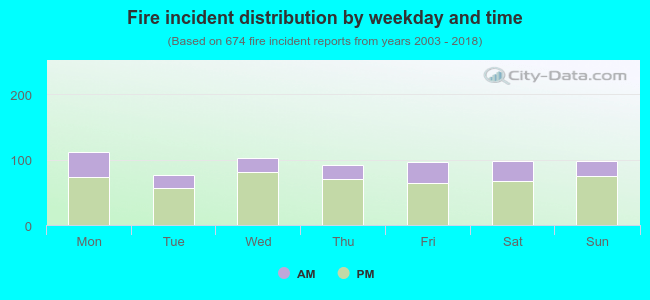 27.6% incidents where reported in the morning and 72.4% in the evening. The most fires (16.6%) took place on Monday, and the least (11.3%) on Tuesday.
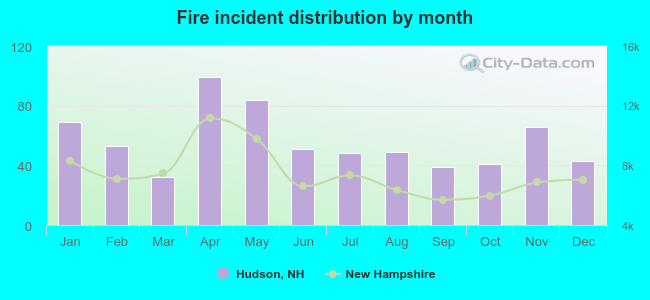 According to the 674 fire incidents from years 2003 - 2018 most fires (14.7%) took place during April, and the least (4.7%) in March.
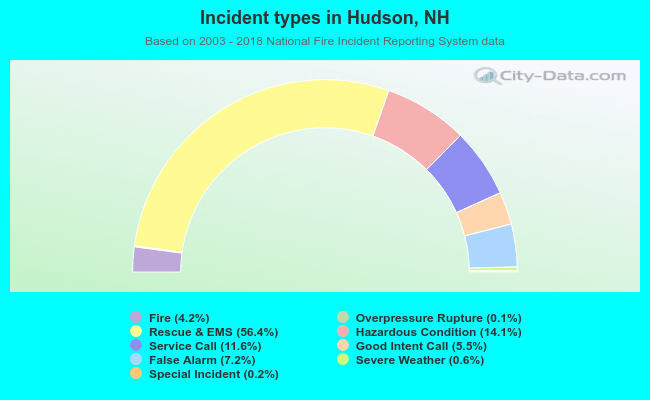 Out of all 15,926 cases reported during the years 2003 - 2018, the most belonged to the categories: Rescue & EMS (56.4%), Hazardous Condition (14.1%), and Service Call (11.6%).
 When looking into fire subcategories, the most reports belonged to: Structure Fires (43.8%), and Outside Fires (33.2%).