Merrimack: Fire Incidents, New Hampshire (NH)
Where are fire incidents reported in Merrimack, NH
Something went wrong! Please refresh the page.
| Fire incidents reported | |
|---|---|
| Sreet name | Count |
| DANIEL WEBSTER HWY | 278 |
| FE EVERETT TPKE | 88 |
| FE. EVERETT TPKE | 70 |
| AMHERST RD | 54 |
| BABOOSIC LAKE RD | 50 |
| MILFORD RD | 40 |
| LONDON CT | 38 |
| TURKEY HILL RD | 26 |
| CONTINENTAL BLVD | 24 |
| NATICOOK RD | 22 |
| WIRE RD | 20 |
| BEDFORD RD | 18 |
| EASTRIDGE RD | 18 |
| BACK RIVER RD | 16 |
| EXECUTIVE PARK DR | 16 |
| MANCHESTER ST | 16 |
| STAR DR | 16 |
| FEARON RD | 14 |
| PEASLEE RD | 14 |
| RAILROAD AVE | 14 |
| LAWRENCE RD | 12 |
| MERRIMACK DR | 12 |
| OLD BLOOD RD | 12 |
| PREMIUM OUTLET BLVD | 12 |
| BOWERS LANDING DR | 10 |
| COLUMBIA CIR | 10 |
| DANIEL WEBSTER HIGHWAY | 10 |
| DERRY ST | 10 |
| GREATSTONE DR | 10 |
| HOLTS LANDING DR | 10 |
| Other | 65 |
2003 - 2018 National Fire Incident Reporting System (NFIRS) incidents
- Incident types reported to NFIRS in Merrimack, NH
- 8,67552.9%Rescue & EMS
- 2,66916.3%Hazardous Condition
- 1,72410.5%False Alarm
- 1,1757.2%Service Call
- 1,0256.3%Fire
- 9956.1%Good Intent Call
- 940.6%Severe Weather
- 220.1%Overpressure Rupture
- Fire incident types reported to NFIRS in Merrimack, NH
- 47746.5%Structure Fires
- 34934.0%Outside Fires
- 17116.7%Mobile Property/Vehicle Fires
- 282.7%Other
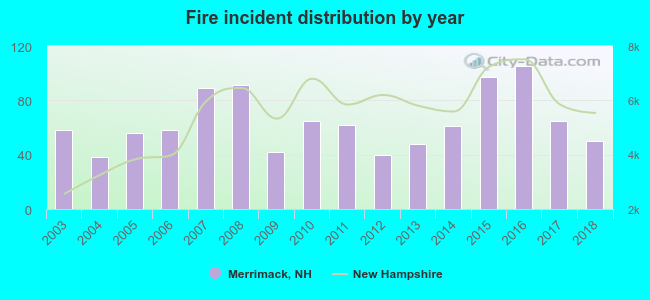 Based on the data from the years 2003 - 2018 the average number of fires per year is 64. The highest number of reported fire incidents - 105 took place in 2016, and the least - 38 in 2004. The data has a decreasing trend.
The average number of yearly fire incidents per 10k residents in Merrimack, NH compared to nearest cities:
(Note: Based on data for the last 3 years, including only cities with population 5,000 and above)
| Merrimack: | 28.8 |
| Litchfield: | 33.5 |
| Amherst: | 21.4 |
| Bedford: | 24.5 |
| Milford: | 47.2 |
| Nashua: | 30.6 |
| Hudson: | 59.1 |
| Londonderry: | 72.8 |
| Hollis: | 26.0 |
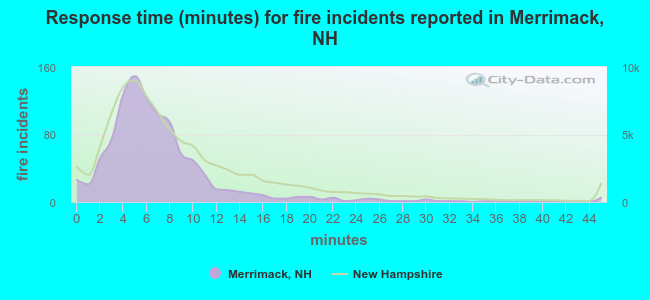 The median response time based on all reported fire incidents is 6 minutes. This is comparable to the state median value.
The median response time in Merrimack, NH compared to nearest cities:
(Note: Based on data for all years, including only cities with at least 500 fire incidents)
| Merrimack: | 6 minutes |
| Amherst: | 8 minutes |
| Bedford: | 7 minutes |
| Milford: | 6 minutes |
| Nashua: | 6 minutes |
| Hudson: | 6 minutes |
| Londonderry: | 6 minutes |
| Manchester: | 5 minutes |
| Derry: | 5 minutes |
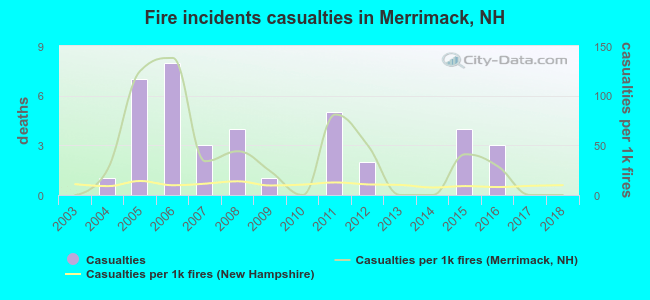 According to the reports from the years 2003 - 2018 the average number of fire-related casualties per year is 2. The highest number of injuries - 8 took place in 2006, and the lowest - 0 in 2003. The data has a constant trend.
The average number of casualties per 1,000 fire incidents is 37. This indicator was the highest - 138 in 2006, and the lowest 0 in 2003. The trend for casualties per 1,000 incidents is constant. Compared to the New Hampshire value the number of injuries per 1,000 fires is much higher.
According to the reports from the years 2003 - 2018 the average number of fire-related casualties per year is 2. The highest number of injuries - 8 took place in 2006, and the lowest - 0 in 2003. The data has a constant trend.
The average number of casualties per 1,000 fire incidents is 37. This indicator was the highest - 138 in 2006, and the lowest 0 in 2003. The trend for casualties per 1,000 incidents is constant. Compared to the New Hampshire value the number of injuries per 1,000 fires is much higher.Casualties per 1,000 incidents in Merrimack, NH compared to nearest cities:
(Note: Based on data for all years, including only cities with at least 500 fire incidents)
| Merrimack: | 37.1 |
| Amherst: | 3.4 |
| Bedford: | 11.3 |
| Milford: | 18.9 |
| Nashua: | 23.7 |
| Hudson: | 19.3 |
| Londonderry: | 7.7 |
| Manchester: | 22.6 |
| Derry: | 25.2 |
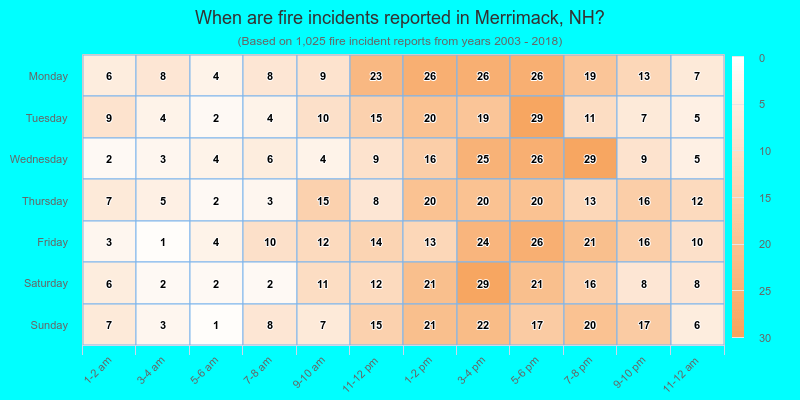
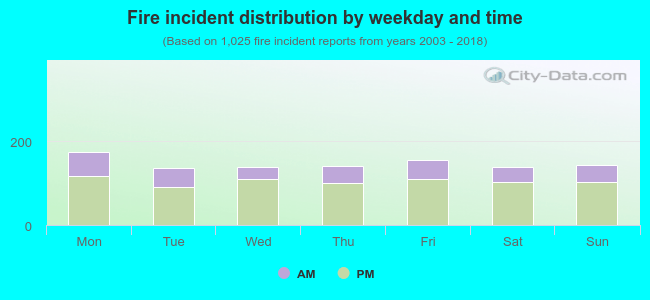 28.3% incidents where reported in the morning and 71.7% in the evening. The most fires (17.1%) took place on Monday, and the least (13.2%) on Tuesday.
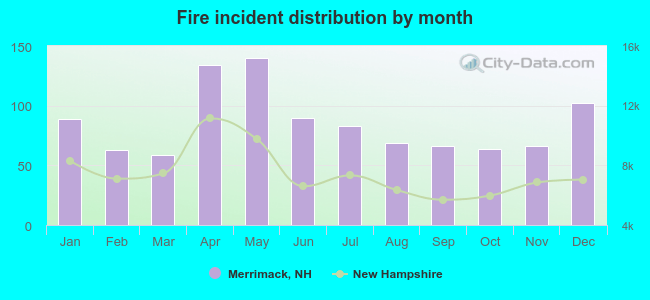 According to the 1,025 fire incident reports from years 2003 - 2018 most fires (13.7%) took place during May, and the least (5.8%) in March.
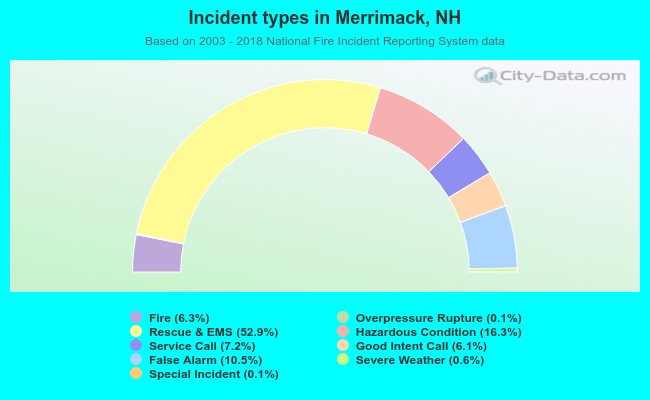 Out of all 16,390 cases reported during the years 2003 - 2018, the most belonged to the categories: Rescue & EMS (52.9%), Hazardous Condition (16.3%), and False Alarm (10.5%).
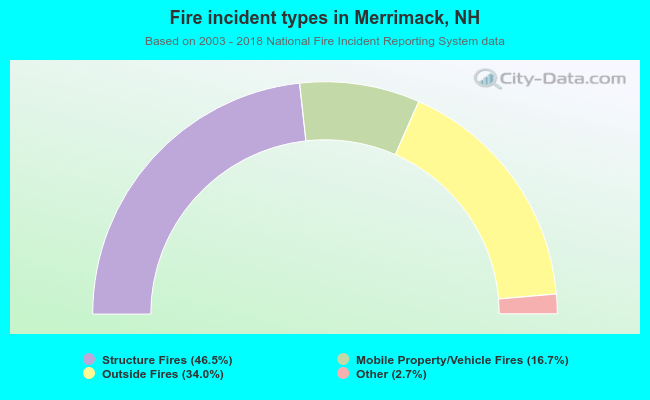 When looking into fire subcategories, the most reports belonged to: Structure Fires (46.5%), and Outside Fires (34.0%).