Hollis: Fire Incidents, New Hampshire (NH)
Where are fire incidents reported in Hollis, NH
Something went wrong! Please refresh the page.
|
| |||||||||||||||||||||||||||||||||||||||||||||||||||||||||||||||||||||||||||||||||||||||||||||||||||||||||||||
2002 - 2018 National Fire Incident Reporting System (NFIRS) incidents
- Incident types reported to NFIRS in Hollis, NH
- 1,54932.8%Rescue & EMS
- 1,02021.6%Hazardous Condition
- 91819.4%Service Call
- 60212.7%False Alarm
- 3547.5%Fire
- 2595.5%Good Intent Call
- 140.3%Special Incident
- 70.1%Severe Weather
- Fire incident types reported to NFIRS in Hollis, NH
- 15042.4%Structure Fires
- 12635.6%Outside Fires
- 4011.3%Mobile Property/Vehicle Fires
- 3810.7%Other
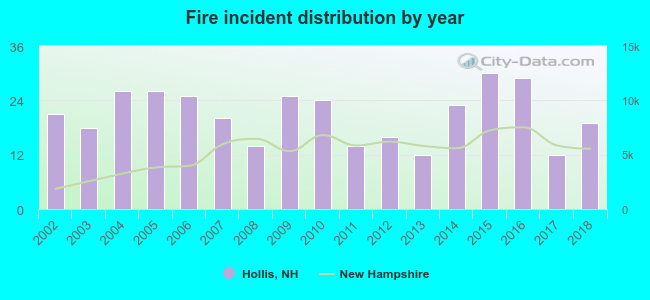 According to the data from the years 2002 - 2018 the average number of fires per year is 21. The highest number of fires - 30 took place in 2015, and the least - 12 in 2013. The data has a declining trend.
The average number of yearly fire incidents per 10k residents in Hollis, NH compared to nearest cities:
(Note: Based on data for the last 3 years, including only cities with population 5,000 and above)
| Hollis: | 26.0 |
| Nashua: | 30.6 |
| Milford: | 47.2 |
| Hudson: | 59.1 |
| Amherst: | 21.4 |
| Merrimack: | 28.8 |
| Litchfield: | 33.5 |
| Pelham: | 37.0 |
| Londonderry: | 72.8 |
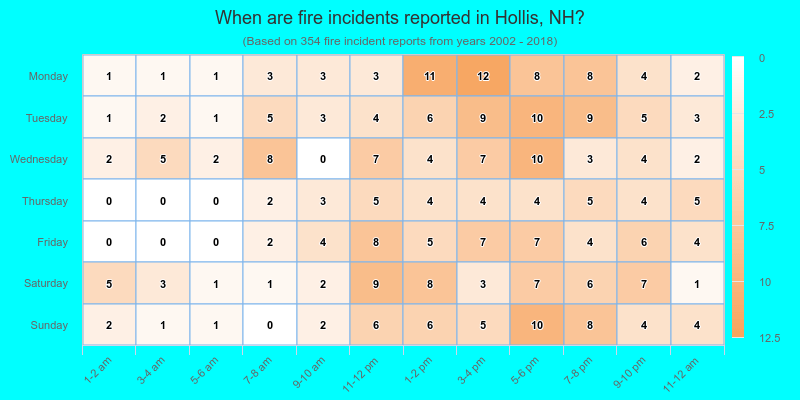
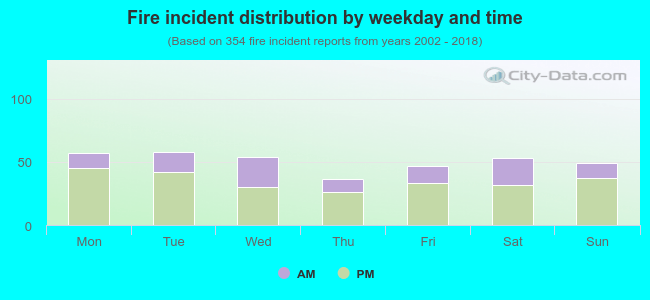 30.8% incidents where reported in the morning and 69.2% in the evening. The most fires (16.4%) took place on Tuesday, and the least (10.2%) on Thursday.
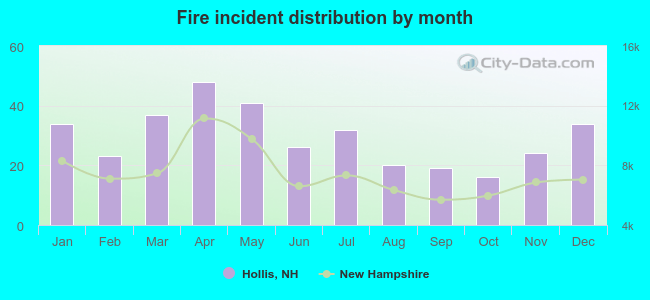 According to the 354 incident reports from years 2002 - 2018 most fires (13.6%) took place during April, and the least (4.5%) in October.
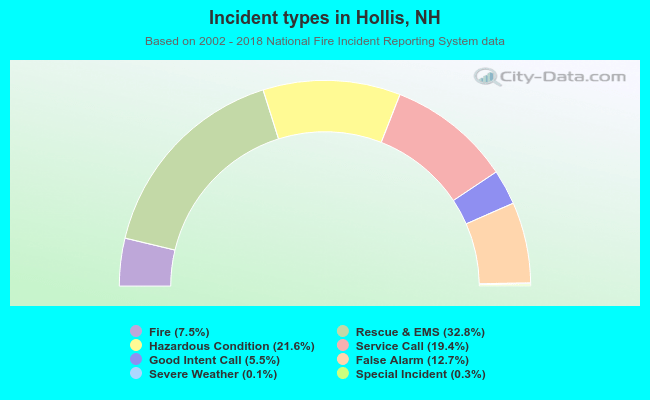 Out of all 4,723 cases reported during the years 2002 - 2018, the most belonged to the categories: Overpressure Rupture (32.8%), Rescue & EMS (21.6%), and Hazardous Condition (19.4%).
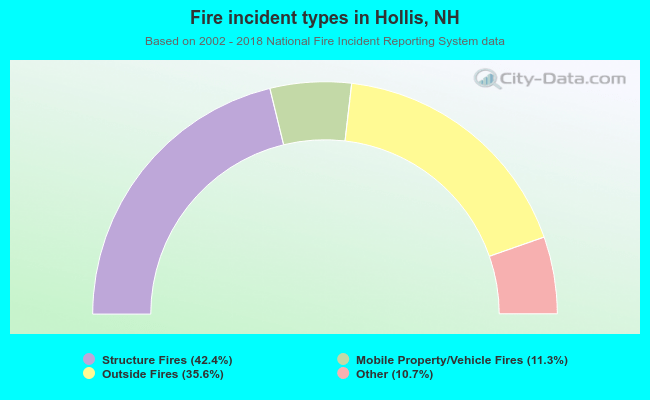 When looking into fire subcategories, the most reports belonged to: Structure Fires (42.4%), and Outside Fires (35.6%).