Hudson: Fire Incidents, Ohio (OH)
Where are fire incidents reported in Hudson, OH
Something went wrong! Please refresh the page.
|
| |||||||||||||||||||||||||||||||||||||||||||||||||||||||||||||||||||||||||||||||||||||||||||||||||||||||||||||
2002 - 2018 National Fire Incident Reporting System (NFIRS) incidents
- Incident types reported to NFIRS in Hudson, OH
- 1,23828.3%Hazardous Condition
- 90720.7%False Alarm
- 63414.5%Fire
- 56212.8%Good Intent Call
- 50711.6%Rescue & EMS
- 50511.5%Service Call
- 150.3%Severe Weather
- 100.2%Special Incident
- Fire incident types reported to NFIRS in Hudson, OH
- 31349.4%Structure Fires
- 20832.8%Outside Fires
- 11217.7%Mobile Property/Vehicle Fires
- 10.2%Other
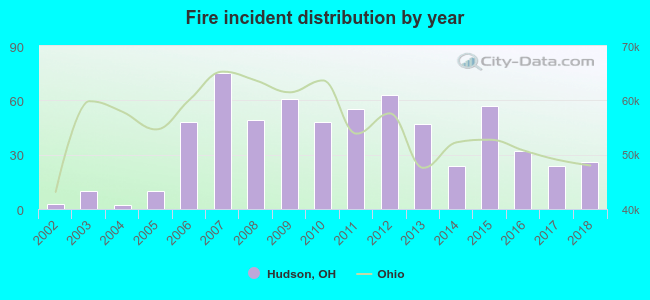 According to the data from the years 2002 - 2018 the average number of fire incidents per year is 37. The highest number of reported fires - 75 took place in 2007, and the least - 2 in 2004. The data has a growing trend.
The average number of yearly fire incidents per 10k residents in Hudson, OH compared to nearest cities:
(Note: Based on data for the last 3 years, including only cities with population 5,000 and above)
| Hudson: | 12.2 |
| Stow: | 18.6 |
| Streetsboro: | 35.3 |
| Twinsburg: | 40.7 |
| Macedonia: | 29.9 |
| Aurora: | 19.9 |
| Munroe Falls: | 12.6 |
| Cuyahoga Falls: | 24.9 |
| Kent: | 26.5 |
 The median response time based on all reported fire incidents is 6 minutes. This is close to the Ohio median value.
The median response time in Hudson, OH compared to nearest cities:
(Note: Based on data for all years, including only cities with at least 500 fire incidents)
| Hudson: | 6 minutes |
| Stow: | 5 minutes |
| Streetsboro: | 6 minutes |
| Twinsburg: | 5 minutes |
| Macedonia: | 5 minutes |
| Aurora: | 5 minutes |
| Cuyahoga Falls: | 4 minutes |
| Kent: | 6 minutes |
| Richfield: | 7 minutes |
 27.6% incidents where reported in the morning and 72.4% in the evening. The most fires (17.2%) took place on Saturday, and the least (12.0%) on Monday.
 Based on the 634 fires from years 2002 - 2018 most fires (12.6%) took place during April, and the least (5.5%) in September.
 Out of all 4,381 cases reported during the years 2002 - 2018, the most belonged to the categories: Hazardous Condition (28.3%), False Alarm (20.7%), and Fire (14.5%).
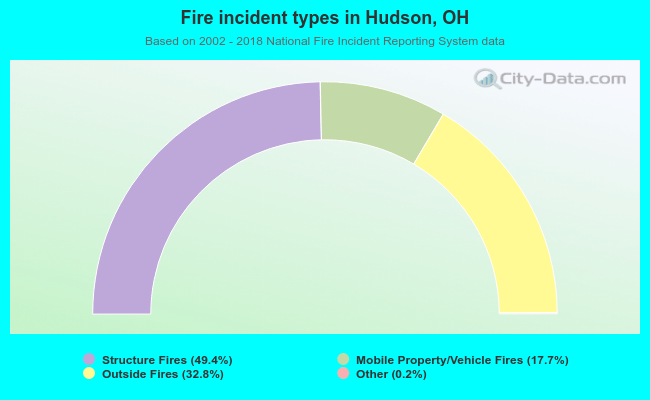 When looking into fire subcategories, the most incidents belonged to: Structure Fires (49.4%), and Outside Fires (32.8%).