Twinsburg: Fire Incidents, Ohio (OH)
Where are fire incidents reported in Twinsburg, OH
Something went wrong! Please refresh the page.
| Fire incidents reported | |
|---|---|
| Sreet name | Count |
| RAVENNA 10069-11679 RD | 98 |
| RAY CT | 92 |
| AURORA 1816-2732 RD | 84 |
| AURORA 18162732 RD | 56 |
| RAVENNA 1006911679 RD | 50 |
| DARROW PARK DR | 48 |
| DARROW 08864-09023 RD | 42 |
| GETTYSBURG DR | 40 |
| HIGHLAND 1333-1949 RD | 40 |
| BAVARIA RD | 36 |
| HIGHLAND RD | 36 |
| DARROW 08054-08809 RD | 30 |
| DARROW 09043-09819 RD | 30 |
| ENTERPRISE 14001800 PKY | 24 |
| CHAMBERLIN 0847008650 RD | 22 |
| DARROW 0904309819 RD | 22 |
| GLENWOOD 2100 - LIBERTY DR | 22 |
| PRESIDENTIAL PKY | 22 |
| TWINSBURG RD | 22 |
| WESTWOOD DR | 22 |
| DARROW 0805408809 RD | 20 |
| RAVENNA 09011-09753 RD | 20 |
| SHEPARD RD | 20 |
| SHERWIN DR | 20 |
| BELMEADOW DR | 18 |
| DARROW 0886409023 RD | 18 |
| HIGHLAND 13331949 RD | 18 |
| PEBBLE CREEK DR | 18 |
| POST RD | 18 |
| RAVENNA RD | 18 |
| Other | 447 |
2002 - 2018 National Fire Incident Reporting System (NFIRS) incidents
- Incident types reported to NFIRS in Twinsburg, OH
- 10,85566.2%Rescue & EMS
- 1,73210.6%Hazardous Condition
- 1,4739.0%Fire
- 1,2737.8%False Alarm
- 6554.0%Service Call
- 3191.9%Good Intent Call
- 540.3%Special Incident
- 300.2%Severe Weather
- 170.1%Overpressure Rupture
- Fire incident types reported to NFIRS in Twinsburg, OH
- 74650.6%Structure Fires
- 46231.4%Outside Fires
- 26017.7%Mobile Property/Vehicle Fires
- 50.3%Other
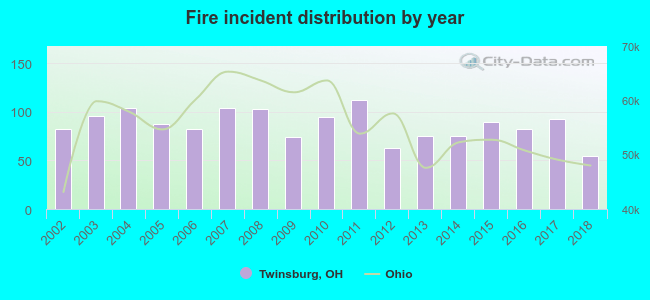 According to the data from the years 2002 - 2018 the average number of fire incidents per year is 87. The highest number of reported fire incidents - 112 took place in 2011, and the least - 55 in 2018. The data has a decreasing trend.
The average number of yearly fire incidents per 10k residents in Twinsburg, OH compared to nearest cities:
(Note: Based on data for the last 3 years, including only cities with population 5,000 and above)
| Twinsburg: | 40.7 |
| Macedonia: | 29.9 |
| Solon: | 38.6 |
| Aurora: | 19.9 |
| Hudson: | 12.2 |
| Bedford Heights: | 28.7 |
| Bedford: | 51.5 |
| Streetsboro: | 35.3 |
| Maple Heights: | 15.1 |
 The median response time based on all reported fire incidents is 5 minutes. This is lower compared to the Ohio median value.
The median response time in Twinsburg, OH compared to nearest cities:
(Note: Based on data for all years, including only cities with at least 500 fire incidents)
| Twinsburg: | 5 minutes |
| Macedonia: | 5 minutes |
| Solon: | 6 minutes |
| Aurora: | 5 minutes |
| Hudson: | 6 minutes |
| Bedford: | 4 minutes |
| Streetsboro: | 6 minutes |
| Bainbridge: | 15 minutes |
| Brecksville: | 6 minutes |
 According to the reports from the years 2002 - 2018 the average number of fire-related casualties per year is 1. The highest number of casualties - 4 took place in 2005, and the lowest - 0 in 2002. The data has a growing trend.
The average number of injuries per 1,000 fires is 17. This indicator was the highest - 55 in 2018, and the lowest 0 in 2002. The trend for casualties per 1,000 incidents is growing. Compared to the Ohio value the number of casualties per 1,000 fires is similar.
According to the reports from the years 2002 - 2018 the average number of fire-related casualties per year is 1. The highest number of casualties - 4 took place in 2005, and the lowest - 0 in 2002. The data has a growing trend.
The average number of injuries per 1,000 fires is 17. This indicator was the highest - 55 in 2018, and the lowest 0 in 2002. The trend for casualties per 1,000 incidents is growing. Compared to the Ohio value the number of casualties per 1,000 fires is similar.Casualties per 1,000 incidents in Twinsburg, OH compared to nearest cities:
(Note: Based on data for all years, including only cities with at least 500 fire incidents)
| Twinsburg: | 17.0 |
| Macedonia: | 2.9 |
| Solon: | 12.9 |
| Aurora: | 37.6 |
| Hudson: | 1.6 |
| Bedford: | 17.1 |
| Streetsboro: | 10.4 |
| Bainbridge: | 2.3 |
| Brecksville: | 0.0 |
 32.4% incidents where reported in the morning and 67.6% in the evening. The most fires (15.6%) took place on Wednesday, and the least (11.9%) on Thursday.
 According to the 1,473 fire incident reports from years 2002 - 2018 most fires (10.3%) took place during July, and the least (6.1%) in October.
 Out of all 16,408 cases reported during the years 2002 - 2018, the most belonged to the categories: Rescue & EMS (66.2%), Hazardous Condition (10.6%), and Fire (9.0%).
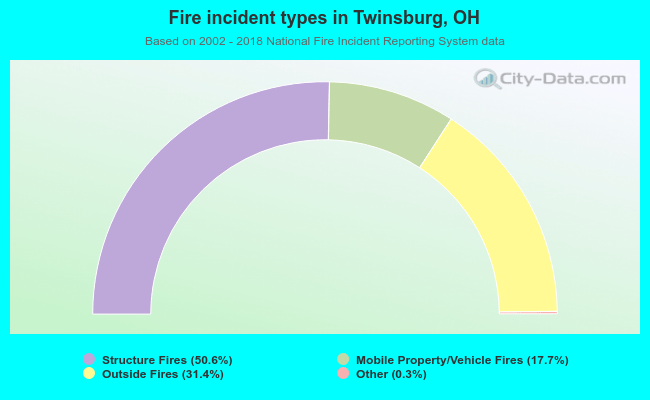 When looking into fire subcategories, the most reports belonged to: Structure Fires (50.6%), and Outside Fires (31.4%).