Munroe Falls: Fire Incidents, Ohio (OH)
Where are fire incidents reported in Munroe Falls, OH
Something went wrong! Please refresh the page.
|
| |||||||||||||||||||||||||||||||||||||||||||||||||||||||||||||||||||||||||||||||||||||||||||||||||||||||||||||
2002 - 2018 National Fire Incident Reporting System (NFIRS) incidents
- Incident types reported to NFIRS in Munroe Falls, OH
- 1,16744.0%Rescue & EMS
- 48618.3%Service Call
- 46717.6%Hazardous Condition
- 2399.0%False Alarm
- 1575.9%Fire
- 722.7%Good Intent Call
- 341.3%Severe Weather
- 301.1%Special Incident
- Fire incident types reported to NFIRS in Munroe Falls, OH
- 9359.2%Structure Fires
- 4528.7%Outside Fires
- 1811.5%Mobile Property/Vehicle Fires
- 10.6%Other
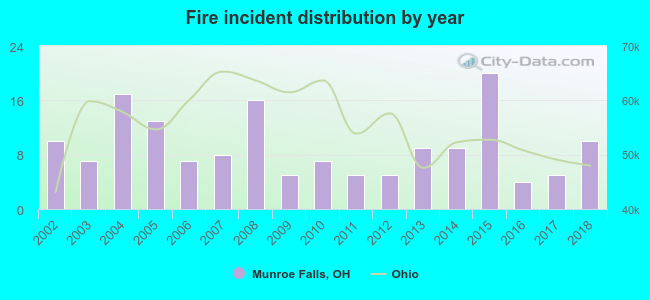 Based on the data from the years 2002 - 2018 the average number of fires per year is 9. The highest number of reported fire incidents - 20 took place in 2015, and the least - 4 in 2016. The data has a constant trend.
The average number of yearly fire incidents per 10k residents in Munroe Falls, OH compared to nearest cities:
(Note: Based on data for the last 3 years, including only cities with population 5,000 and above)
| Munroe Falls: | 12.6 |
| Stow: | 18.6 |
| Tallmadge: | 28.1 |
| Cuyahoga Falls: | 24.9 |
| Kent: | 26.5 |
| Akron: | 43.8 |
| Hudson: | 12.2 |
| Streetsboro: | 35.3 |
| Fairlawn: | 48.5 |

 31.8% incidents where reported in the morning and 68.2% in the evening. The most fires (17.2%) took place on Friday, and the least (12.7%) on Wednesday.
 Based on the 157 incident reports from years 2002 - 2018 most fires (11.5%) took place during April, and the least (2.5%) in October.
 Out of all 2,653 cases reported during the years 2002 - 2018, the most belonged to the categories: Rescue & EMS (44.0%), Service Call (18.3%), and Hazardous Condition (17.6%).
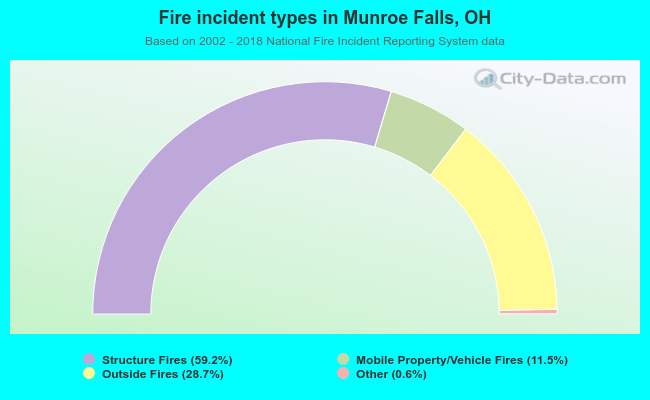 When looking into fire subcategories, the most reports belonged to: Structure Fires (59.2%), and Outside Fires (28.7%).