Janesville: Fire Incidents, Wisconsin (WI)
Where are fire incidents reported in Janesville, WI
Something went wrong! Please refresh the page.
| Fire incidents reported | |
|---|---|
| Sreet name | Count |
| RIVER RD | 200 |
| MILTON AVE | 188 |
| MAIN ST | 116 |
| INTERSTATE 90 | 110 |
| CENTER AVE | 104 |
| RACINE ST | 100 |
| BELOIT AVE | 92 |
| MILWAUKEE ST | 92 |
| COURT ST | 82 |
| JACKSON ST | 78 |
| WASHINGTON ST | 74 |
| ROCKPORT RD | 64 |
| KELLOGG AVE | 62 |
| FRANKLIN ST | 56 |
| U.S. HWY. 14 | 54 |
| HUMES RD | 52 |
| MINERAL POINT AVE | 52 |
| OAKHILL AVE | 48 |
| PEARL ST | 46 |
| BLACKBRIDGE RD | 44 |
| HANOVER RD | 42 |
| LEXINGTON DR | 42 |
| MEMORIAL DR | 42 |
| ACADEMY ST | 38 |
| AVALON RD | 38 |
| CROSBY AVE | 38 |
| DEERFIELD DR | 38 |
| DELAVAN DR | 38 |
| PONTIAC DR | 38 |
| WRIGHT RD | 38 |
| Other | 732 |
2002 - 2018 National Fire Incident Reporting System (NFIRS) incidents
- Incident types reported to NFIRS in Janesville, WI
- 30,61868.9%Rescue & EMS
- 4,0719.2%Service Call
- 2,8386.4%Fire
- 2,4845.6%False Alarm
- 2,1694.9%Hazardous Condition
- 2,0414.6%Good Intent Call
- 1060.2%Overpressure Rupture
- 780.2%Special Incident
- Fire incident types reported to NFIRS in Janesville, WI
- 1,06937.7%Structure Fires
- 89631.6%Outside Fires
- 52018.3%Mobile Property/Vehicle Fires
- 35312.4%Other
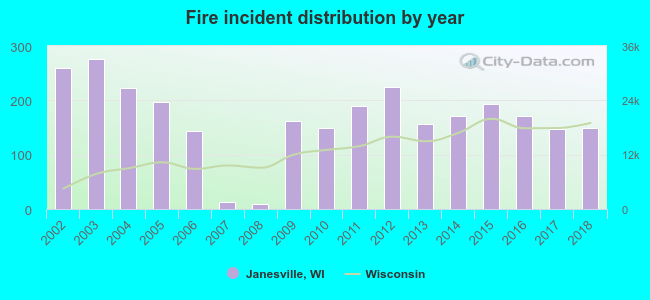 According to the data from the years 2002 - 2018 the average number of fires per year is 167. The highest number of reported fire incidents - 276 took place in 2003, and the least - 10 in 2008. The data has a declining trend.
The average number of yearly fire incidents per 10k residents in Janesville, WI compared to nearest cities:
(Note: Based on data for the last 3 years, including only cities with population 5,000 and above)
| Janesville: | 24.4 |
| Milton: | 71.0 |
| Edgerton: | 45.3 |
| Beloit: | 50.3 |
| Evansville: | 63.1 |
| Whitewater: | 38.1 |
| Fort Atkinson: | 33.5 |
| Stoughton: | 46.8 |
| Delavan: | 57.2 |
 The median response time based on all reported fire incidents is 6 minutes. This is close to the Wisconsin median value.
The median response time in Janesville, WI compared to nearest cities:
(Note: Based on data for all years, including only cities with at least 500 fire incidents)
| Janesville: | 6 minutes |
| Milton: | 11 minutes |
| Edgerton: | 10 minutes |
| Beloit: | 6 minutes |
| Rockton: | 7 minutes |
| Whitewater: | 11 minutes |
| Roscoe: | 6 minutes |
| Fort Atkinson: | 8 minutes |
| Delavan: | 7 minutes |
 Based on the reports from the years 2002 - 2018 the average number of fire-related fatalities per year is 0. The highest number of reported deaths - 1 took place in 2004, and the lowest - 0 in 2002. The data has a constant trend.
The average number of fatalities per 1,000 fire incidents is 1. This indicator was the highest - 7 in 2017, and the lowest 0 in 2002. The trend for fatalities per 1,000 incidents is constant. Compared to the state value the number of deaths per 1,000 incidents is lower.
Based on the reports from the years 2002 - 2018 the average number of fire-related fatalities per year is 0. The highest number of reported deaths - 1 took place in 2004, and the lowest - 0 in 2002. The data has a constant trend.
The average number of fatalities per 1,000 fire incidents is 1. This indicator was the highest - 7 in 2017, and the lowest 0 in 2002. The trend for fatalities per 1,000 incidents is constant. Compared to the state value the number of deaths per 1,000 incidents is lower.Deaths per 1,000 incidents in Janesville, WI compared to nearest cities:
(Note: Based on data for all years, including only cities with at least 2,500 fire incidents)
| Janesville: | 1.1 |
 Based on the reports from the years 2002 - 2018 the average number of fire-related yearly casualties is 3. The highest number of casualties - 10 took place in 2004, and the lowest - 0 in 2006. The data has a declining trend.
The average number of injuries per 1,000 fires is 13. This indicator was the highest - 45 in 2004, and the lowest 0 in 2006. The trend for injuries per 1,000 incidents is dropping. Compared to the state value the number of casualties per 1,000 incidents is higher.
Based on the reports from the years 2002 - 2018 the average number of fire-related yearly casualties is 3. The highest number of casualties - 10 took place in 2004, and the lowest - 0 in 2006. The data has a declining trend.
The average number of injuries per 1,000 fires is 13. This indicator was the highest - 45 in 2004, and the lowest 0 in 2006. The trend for injuries per 1,000 incidents is dropping. Compared to the state value the number of casualties per 1,000 incidents is higher.Casualties per 1,000 incidents in Janesville, WI compared to nearest cities:
(Note: Based on data for all years, including only cities with at least 500 fire incidents)
| Janesville: | 15.5 |
| Milton: | 2.0 |
| Edgerton: | 0.0 |
| Beloit: | 14.4 |
| Rockton: | 2.1 |
| Whitewater: | 3.8 |
| Roscoe: | 6.5 |
| Fort Atkinson: | 1.8 |
| Delavan: | 18.6 |
 30.8% incidents where reported in the morning and 69.2% in the evening. The most fires (15.2%) took place on Wednesday, and the least (12.7%) on Friday.
 Based on the 2,838 reports from years 2002 - 2018 most fires (12.5%) took place during April, and the least (6.2%) in February.
 Out of all 44,423 cases reported during the years 2002 - 2018, the most belonged to the categories: Rescue & EMS (68.9%), Service Call (9.2%), and Fire (6.4%).
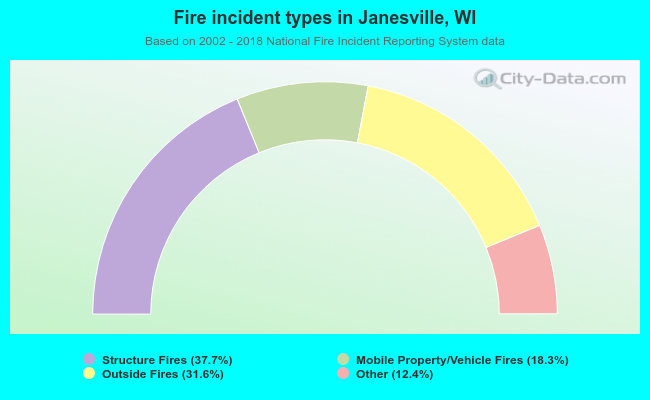 When looking into fire subcategories, the most incidents belonged to: Structure Fires (37.7%), and Outside Fires (31.6%).