Beloit: Fire Incidents, Wisconsin (WI)
Where are fire incidents reported in Beloit, WI
Something went wrong! Please refresh the page.
| Fire incidents reported | |
|---|---|
| Sreet name | Count |
| RIVERSIDE DR | 122 |
| PARK AVE | 96 |
| GRAND AVE | 94 |
| PRAIRIE AVE | 88 |
| WISCONSIN AVE | 68 |
| CHURCH ST | 66 |
| DEWEY AVE | 58 |
| LIBERTY AVE | 48 |
| COLLEY RD | 44 |
| COLONY CT | 42 |
| MILWAUKEE RD | 42 |
| PORTER AVE | 42 |
| MADISON RD | 40 |
| GATEWAY BLVD | 38 |
| PORTLAND AVE | 38 |
| BLUFF ST | 36 |
| PUBLIC AVE | 36 |
| HENRY AVE | 34 |
| FOURTH ST | 32 |
| PLEASANT ST | 32 |
| CENTRAL AVE | 30 |
| HIGHLAND AVE | 30 |
| COPELAND AVE | 28 |
| SIXTH ST | 28 |
| TENTH ST | 28 |
| BROAD ST | 26 |
| BURTON ST | 26 |
| CREEDY RD | 26 |
| GRANT ST | 26 |
| VERNON AVE | 26 |
| Other | 924 |
2003 - 2018 National Fire Incident Reporting System (NFIRS) incidents
- Incident types reported to NFIRS in Beloit, WI
- 15,03260.3%Rescue & EMS
- 2,88411.6%Service Call
- 2,2949.2%Fire
- 1,9677.9%Hazardous Condition
- 1,3385.4%Good Intent Call
- 1,2675.1%False Alarm
- 1140.5%Special Incident
- 270.1%Overpressure Rupture
- Fire incident types reported to NFIRS in Beloit, WI
- 1,18751.7%Structure Fires
- 63827.8%Outside Fires
- 35815.6%Mobile Property/Vehicle Fires
- 1114.8%Other
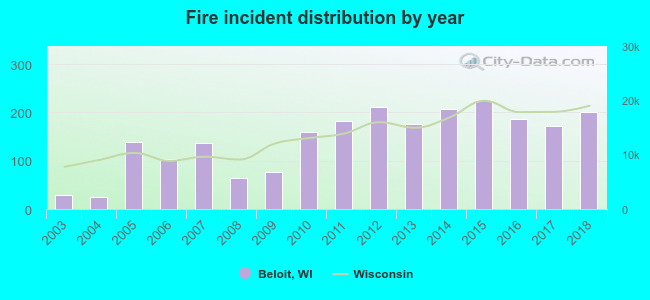 Based on the data from the years 2003 - 2018 the average number of fires per year is 143. The highest number of reported fire incidents - 225 took place in 2015, and the least - 25 in 2004. The data has a rising trend.
The average number of yearly fire incidents per 10k residents in Beloit, WI compared to nearest cities:
(Note: Based on data for the last 3 years, including only cities with population 5,000 and above)
| Beloit: | 50.3 |
| Janesville: | 24.4 |
| Milton: | 71.0 |
| Delavan: | 57.2 |
| Edgerton: | 45.3 |
| Evansville: | 63.1 |
| Whitewater: | 38.1 |
| Elkhorn: | 67.2 |
| Stoughton: | 46.8 |
 The median response time based on all reported fire incidents is 6 minutes. This is similar to the state median value.
The median response time in Beloit, WI compared to nearest cities:
(Note: Based on data for all years, including only cities with at least 500 fire incidents)
| Beloit: | 6 minutes |
| Rockton: | 7 minutes |
| Roscoe: | 6 minutes |
| Machesney Park: | 7 minutes |
| Janesville: | 6 minutes |
| Loves Park: | 9 minutes |
| Rockford: | 5 minutes |
| Milton: | 11 minutes |
| Winnebago: | 12 minutes |
 According to the reports from the years 2003 - 2018 the average number of fire-related fatalities per year is 0. The highest number of reported deaths - 3 took place in 2014, and the lowest - 0 in 2003. The data has a growing trend.
 Based on the reports from the years 2003 - 2018 the average number of fire-related casualties per year is 2. The highest number of injuries - 10 took place in 2017, and the lowest - 0 in 2003. The data has an increasing trend.
The average number of injuries per 1,000 fire incidents is 11. This indicator was the highest - 58 in 2017, and the lowest 0 in 2003. The trend for injuries per 1,000 fire incidents is growing. Compared to the Wisconsin value the number of injuries per 1,000 incidents is higher.
Based on the reports from the years 2003 - 2018 the average number of fire-related casualties per year is 2. The highest number of injuries - 10 took place in 2017, and the lowest - 0 in 2003. The data has an increasing trend.
The average number of injuries per 1,000 fire incidents is 11. This indicator was the highest - 58 in 2017, and the lowest 0 in 2003. The trend for injuries per 1,000 fire incidents is growing. Compared to the Wisconsin value the number of injuries per 1,000 incidents is higher.Casualties per 1,000 incidents in Beloit, WI compared to nearest cities:
(Note: Based on data for all years, including only cities with at least 500 fire incidents)
| Beloit: | 14.4 |
| Rockton: | 2.1 |
| Roscoe: | 6.5 |
| Machesney Park: | 7.3 |
| Janesville: | 15.5 |
| Loves Park: | 11.2 |
| Rockford: | 16.6 |
| Milton: | 2.0 |
| Winnebago: | 1.7 |
 33.8% incidents where reported in the morning and 66.2% in the evening. The most fires (15.3%) took place on Monday, and the least (13.2%) on Tuesday.
 According to the 2,294 incident reports from years 2003 - 2018 most fires (12.4%) took place during July, and the least (6.3%) in December.
 Out of all 24,933 cases reported during the years 2003 - 2018, the most belonged to the categories: Rescue & EMS (60.3%), Service Call (11.6%), and Fire (9.2%).
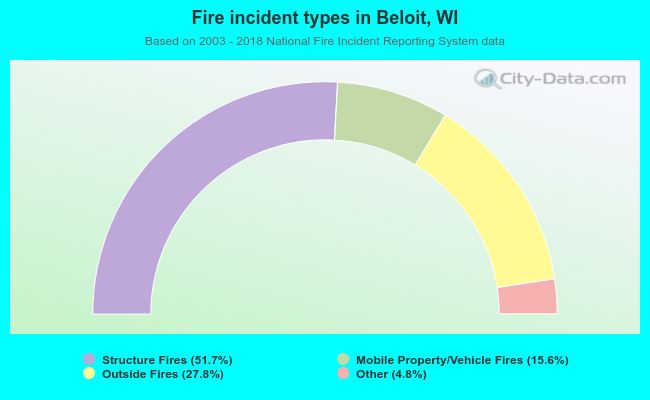 When looking into fire subcategories, the most reports belonged to: Structure Fires (51.7%), and Outside Fires (27.8%).