Kennett Square: Fire Incidents, Pennsylvania (PA)
Where are fire incidents reported in Kennett Square, PA
Something went wrong! Please refresh the page.
|
| |||||||||||||||||||||||||||||||||||||||||||||||||||||||||||||||||||||||||||||||||||||||||||||||||||||||||||||
2003 - 2018 National Fire Incident Reporting System (NFIRS) incidents
- Incident types reported to NFIRS in Kennett Square, PA
- 1,15235.6%Hazardous Condition
- 88527.3%Fire
- 38311.8%False Alarm
- 2778.6%Good Intent Call
- 2658.2%Service Call
- 2337.2%Rescue & EMS
- 230.7%Special Incident
- 110.3%Severe Weather
- 100.3%Overpressure Rupture
- Fire incident types reported to NFIRS in Kennett Square, PA
- 51958.6%Structure Fires
- 24327.5%Outside Fires
- 758.5%Mobile Property/Vehicle Fires
- 485.4%Other
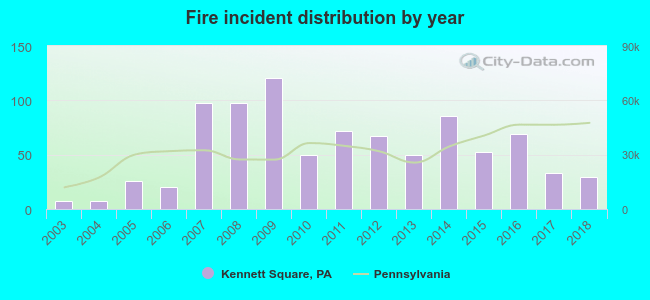 According to the data from the years 2003 - 2018 the average number of fires per year is 55. The highest number of fires - 121 took place in 2009, and the least - 7 in 2003. The data has an increasing trend.
The average number of yearly fire incidents per 10k residents in Kennett Square, PA compared to nearest cities:
(Note: Based on data for the last 3 years, including only cities with population 5,000 and above)
| Kennett Square: | 71.0 |
| West Chester: | 56.6 |
| Coatesville: | 118.0 |
| Downingtown: | 110.0 |
| Oxford: | 96.2 |
| Brookhaven: | 79.3 |
| Media: | 151.6 |
| Paoli: | 18.5 |
| Chester: | 79.4 |
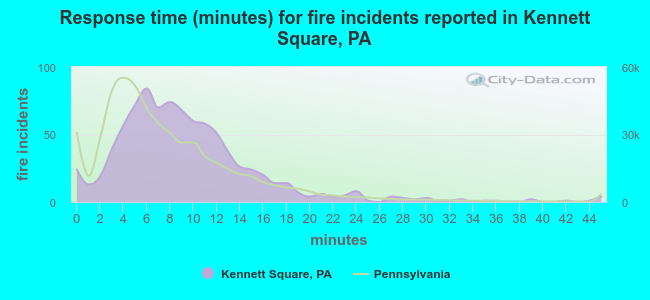 The median response time based on all reported fire incidents is 8 minutes. This is higher than the Pennsylvania median value.
The median response time in Kennett Square, PA compared to nearest cities:
(Note: Based on data for all years, including only cities with at least 500 fire incidents)
| Kennett Square: | 8 minutes |
| Avondale: | 9 minutes |
| Hockessin: | 8 minutes |
| West Chester: | 8 minutes |
| Wilmington: | 6 minutes |
| Coatesville: | 5 minutes |
| Downingtown: | 8 minutes |
| Newark: | 8 minutes |
| Claymont: | 6 minutes |
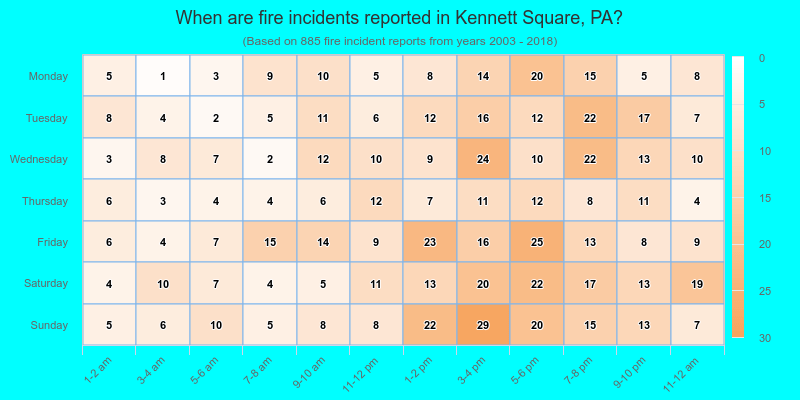
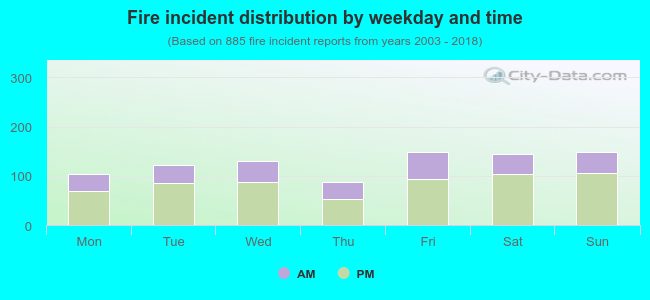 32.1% incidents where reported in the morning and 67.9% in the evening. The most fires (16.8%) took place on Friday, and the least (9.9%) on Thursday.
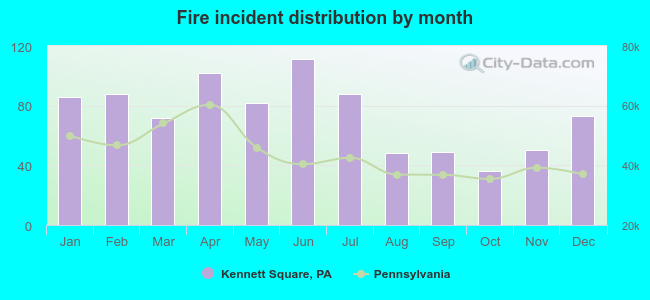 According to the 885 fire incidents from years 2003 - 2018 most fires (12.5%) took place during June, and the least (4.1%) in October.
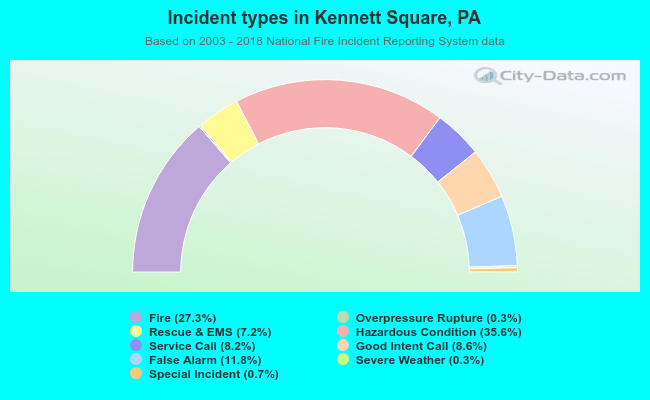 Out of all 3,239 cases reported during the years 2003 - 2018, the most belonged to the categories: Hazardous Condition (35.6%), Fire (27.3%), and False Alarm (11.8%).
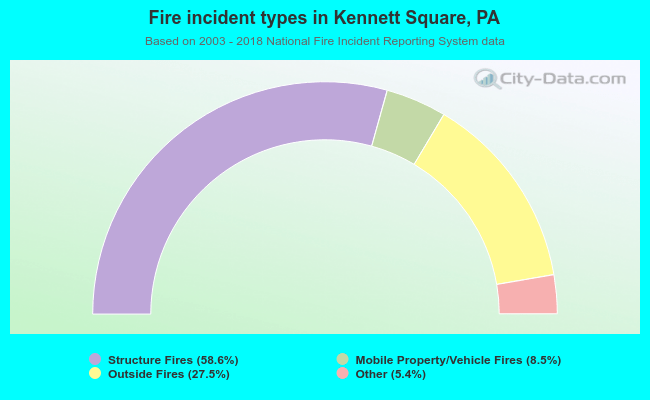 When looking into fire subcategories, the most reports belonged to: Structure Fires (58.6%), and Outside Fires (27.5%).