Coatesville: Fire Incidents, Pennsylvania (PA)
Where are fire incidents reported in Coatesville, PA
Something went wrong! Please refresh the page.
| Fire incidents reported | |
|---|---|
| Sreet name | Count |
| STRODE AVE | 662 |
| ROLLING MILLS DR | 584 |
| LINCOLN HWY | 418 |
| CHESTNUT ST | 228 |
| INGOT DR | 182 |
| COATES ST | 118 |
| LINCOLN HW | 110 |
| OLIVE ST | 110 |
| VALLEY RD | 94 |
| CHARLES ST | 80 |
| MANOR RD | 56 |
| THIRD AV | 54 |
| VICTORIA DR | 54 |
| STRASBURG RD | 52 |
| FLEETWOOD ST | 48 |
| MERCHANT ST | 48 |
| WALNUT ST | 46 |
| FIFTH AVE | 44 |
| CHURCH ST | 42 |
| KINGS HW | 42 |
| LAFAYETTE RD | 42 |
| LINCOLN | 42 |
| FINISHING DR | 40 |
| FOURTH AVE | 40 |
| OLD WILMINGTON RD | 40 |
| DIAMOND ST | 38 |
| REECEVILLE RD | 34 |
| COFFROATH RD | 32 |
| CHESTER AV | 30 |
| DOE RUN RD | 30 |
| Other | 9 |
2003 - 2018 National Fire Incident Reporting System (NFIRS) incidents
- Incident types reported to NFIRS in Coatesville, PA
- 3,44937.4%Fire
- 2,21424.0%Hazardous Condition
- 1,36414.8%Rescue & EMS
- 1,08811.8%False Alarm
- 6447.0%Service Call
- 4084.4%Good Intent Call
- 220.2%Special Incident
- 200.2%Overpressure Rupture
- 100.1%Severe Weather
- Fire incident types reported to NFIRS in Coatesville, PA
- 2,17363.0%Structure Fires
- 69920.3%Outside Fires
- 41512.0%Mobile Property/Vehicle Fires
- 1624.7%Other
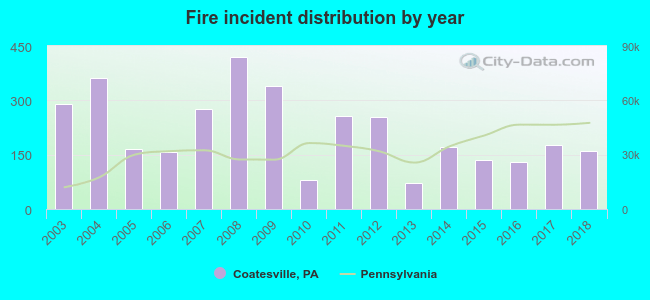 According to the data from the years 2003 - 2018 the average number of fires per year is 216. The highest number of reported fire incidents - 419 took place in 2008, and the least - 73 in 2013. The data has a dropping trend.
The average number of yearly fire incidents per 10k residents in Coatesville, PA compared to nearest cities:
(Note: Based on data for the last 3 years, including only cities with population 5,000 and above)
| Coatesville: | 118.0 |
| Downingtown: | 110.0 |
| Kennett Square: | 71.0 |
| West Chester: | 56.6 |
| Oxford: | 96.2 |
| New Holland: | 72.6 |
| Paoli: | 18.5 |
| Phoenixville: | 65.7 |
| Birdsboro: | 87.4 |
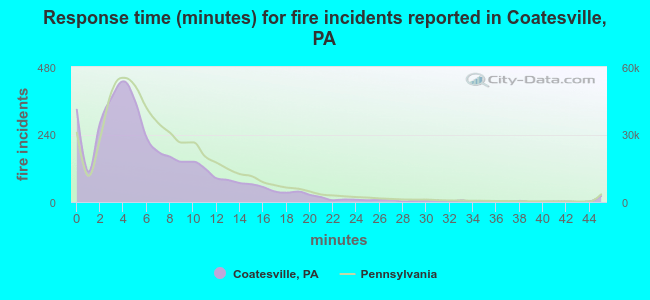 The median response time based on all reported fire incidents is 5 minutes. This is lower than the state median value.
The median response time in Coatesville, PA compared to nearest cities:
(Note: Based on data for all years, including only cities with at least 500 fire incidents)
| Coatesville: | 5 minutes |
| Parkesburg: | 9 minutes |
| Downingtown: | 8 minutes |
| Honey Brook: | 8 minutes |
| Christiana: | 8 minutes |
| Exton: | 6 minutes |
| Gap: | 8 minutes |
| Avondale: | 9 minutes |
| Kennett Square: | 8 minutes |
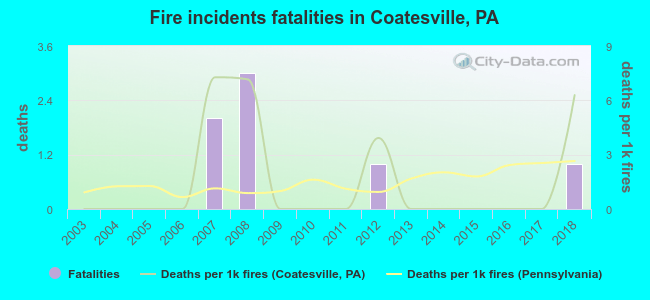 According to the reports from the years 2003 - 2018 the average number of fire-related yearly deaths is 0. The highest number of deaths - 3 took place in 2008, and the lowest - 0 in 2003. The data has an increasing trend.
The average number of fatalities per 1,000 fire incidents is 2. This indicator was the highest - 7 in 2007, and the lowest 0 in 2003. The trend for fatalities per 1,000 incidents is growing. Compared to the state value the number of deaths per 1,000 incidents is higher.
According to the reports from the years 2003 - 2018 the average number of fire-related yearly deaths is 0. The highest number of deaths - 3 took place in 2008, and the lowest - 0 in 2003. The data has an increasing trend.
The average number of fatalities per 1,000 fire incidents is 2. This indicator was the highest - 7 in 2007, and the lowest 0 in 2003. The trend for fatalities per 1,000 incidents is growing. Compared to the state value the number of deaths per 1,000 incidents is higher.Deaths per 1,000 incidents in Coatesville, PA compared to nearest cities:
(Note: Based on data for all years, including only cities with at least 2,500 fire incidents)
| Coatesville: | 2.0 |
| West Chester: | 1.0 |
| Newark: | 1.2 |
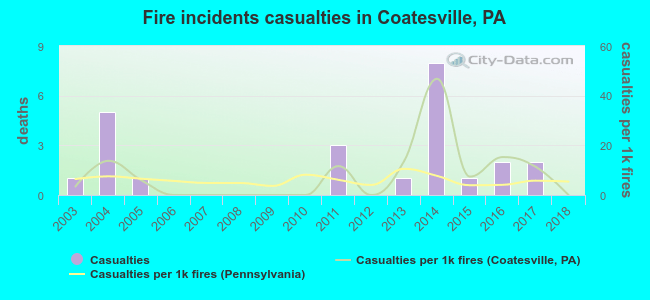 According to the data from the years 2003 - 2018 the average number of fire-related yearly casualties is 2. The highest number of reported injuries - 8 took place in 2014, and the lowest - 0 in 2006. The data has a dropping trend.
The average number of casualties per 1,000 fire incidents is 8. This indicator was the highest - 47 in 2014, and the lowest 0 in 2006. The trend for injuries per 1,000 fire incidents is dropping. Compared to the state value the number of injuries per 1,000 fire incidents is higher.
According to the data from the years 2003 - 2018 the average number of fire-related yearly casualties is 2. The highest number of reported injuries - 8 took place in 2014, and the lowest - 0 in 2006. The data has a dropping trend.
The average number of casualties per 1,000 fire incidents is 8. This indicator was the highest - 47 in 2014, and the lowest 0 in 2006. The trend for injuries per 1,000 fire incidents is dropping. Compared to the state value the number of injuries per 1,000 fire incidents is higher.Casualties per 1,000 incidents in Coatesville, PA compared to nearest cities:
(Note: Based on data for all years, including only cities with at least 500 fire incidents)
| Coatesville: | 7.0 |
| Parkesburg: | 0.0 |
| Downingtown: | 3.5 |
| Honey Brook: | 3.3 |
| Christiana: | 0.0 |
| Exton: | 7.9 |
| Gap: | 2.6 |
| Avondale: | 1.4 |
| Kennett Square: | 3.4 |
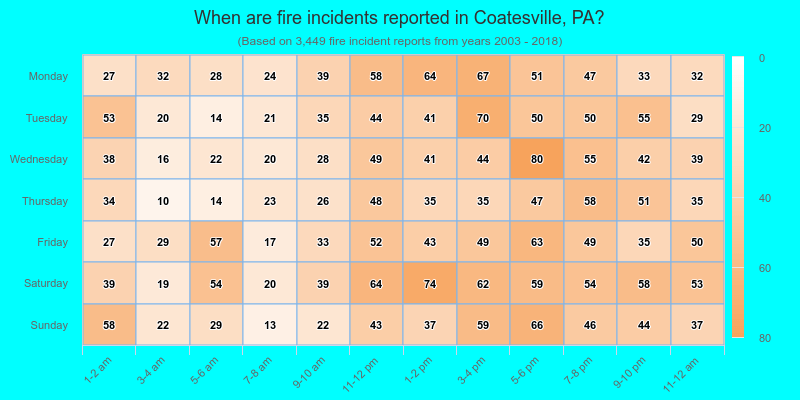
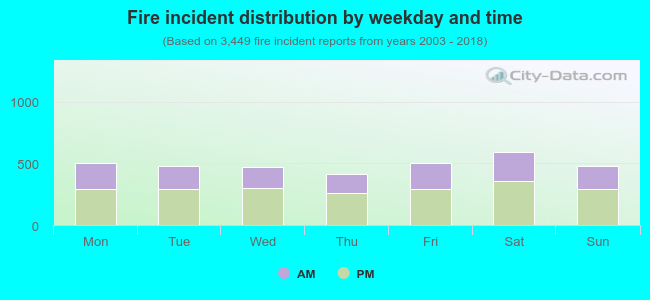 39.4% incidents where reported in the morning and 60.6% in the evening. The most fires (17.3%) took place on Saturday, and the least (12.1%) on Thursday.
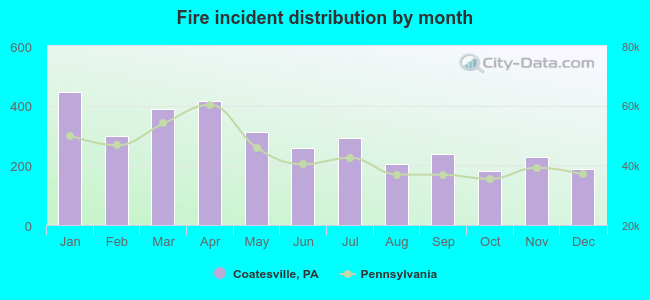 According to the 3,449 fire incident reports from years 2003 - 2018 most fires (12.9%) took place during January, and the least (5.2%) in October.
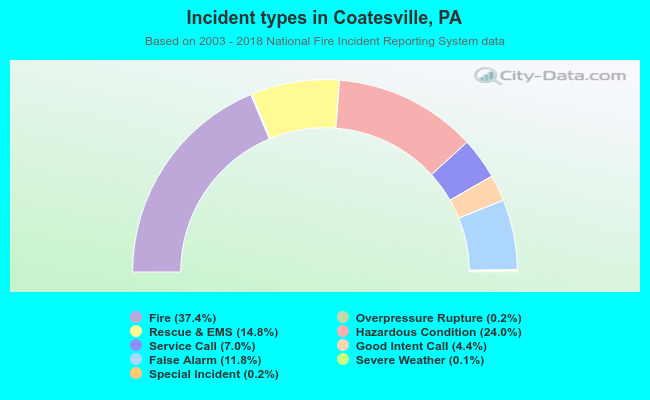 Out of all 9,219 cases reported during the years 2003 - 2018, the most belonged to the categories: Fire (37.4%), Hazardous Condition (24.0%), and Rescue & EMS (14.8%).
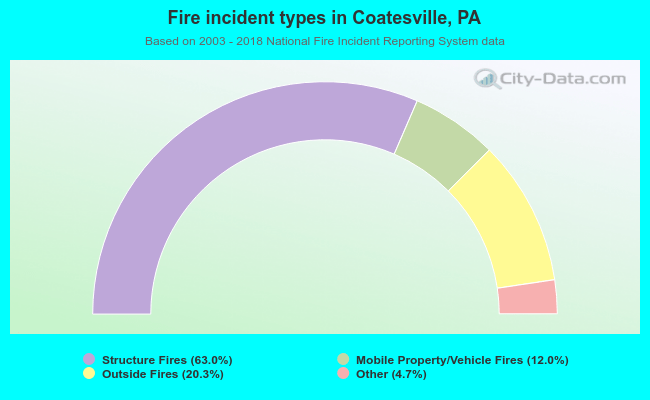 When looking into fire subcategories, the most incidents belonged to: Structure Fires (63.0%), and Outside Fires (20.3%).