Lima: Fire Incidents, Ohio (OH)
Where are fire incidents reported in Lima, OH
Something went wrong! Please refresh the page.
| Fire incidents reported | |
|---|---|
| Sreet name | Count |
| WEST ST | 290 |
| ELM ST | 280 |
| MAIN ST | 266 |
| ROBB AVE | 266 |
| DIXIE HWY | 234 |
| ELIZABETH ST | 234 |
| MARKET ST | 222 |
| COLE ST | 216 |
| UNION ST | 206 |
| KIBBY ST | 202 |
| ELIDA RD | 200 |
| FOURTH ST | 190 |
| METCALF ST | 186 |
| HARDING HWY | 182 |
| WAYNE ST | 176 |
| CABLE RD | 174 |
| HANTHORN RD | 166 |
| NEUBRECHT RD | 156 |
| BLUELICK RD | 152 |
| ALLENTOWN RD | 134 |
| HIGH ST | 134 |
| STEWART RD | 132 |
| SPRING ST | 128 |
| BREESE RD | 126 |
| CENTRAL AVE | 118 |
| NORTH ST | 118 |
| SHAWNEE RD | 116 |
| VINE ST | 114 |
| BIBLE RD | 108 |
| PINE ST | 100 |
| Other | 1,860 |
2002 - 2018 National Fire Incident Reporting System (NFIRS) incidents
- Incident types reported to NFIRS in Lima, OH
- 23,46652.0%Rescue & EMS
- 7,18615.9%Fire
- 5,23111.6%Hazardous Condition
- 4,4509.9%Service Call
- 2,7956.2%Good Intent Call
- 1,8654.1%False Alarm
- 720.2%Overpressure Rupture
- 470.1%Special Incident
- Fire incident types reported to NFIRS in Lima, OH
- 3,11043.3%Structure Fires
- 2,91640.6%Outside Fires
- 1,12215.6%Mobile Property/Vehicle Fires
- 380.5%Other
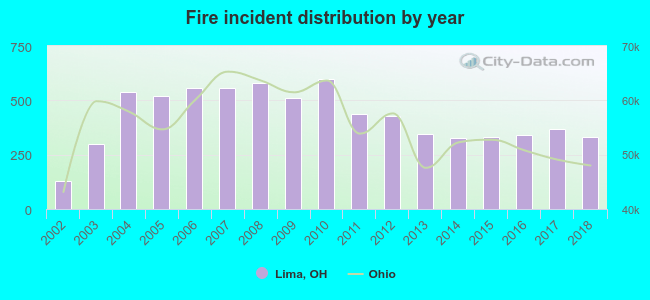 Based on the data from the years 2002 - 2018 the average number of fire incidents per year is 423. The highest number of reported fires - 598 took place in 2010, and the least - 127 in 2002. The data has an increasing trend.
 The median response time based on all reported fire incidents is 4 minutes. This is lower than the state median value.
The median response time in Lima, OH compared to nearest cities:
(Note: Based on data for all years, including only cities with at least 500 fire incidents)
| Lima: | 4 minutes |
| Elida: | 6 minutes |
| Harrod: | 8 minutes |
| Wapakoneta: | 8 minutes |
| Delphos: | 5 minutes |
| Ottawa: | 7 minutes |
| Anna: | 9 minutes |
| Van Wert: | 7 minutes |
| Celina: | 8 minutes |
 According to the reports from the years 2002 - 2018 the average number of fire-related yearly deaths is 1. The highest number of deaths - 4 took place in 2009, and the lowest - 0 in 2002. The data has a constant trend.
The average number of deaths per 1,000 fires is 2. This indicator was the highest - 8 in 2009, and the lowest 0 in 2002. The trend for deaths per 1,000 incidents is constant. Compared to the state value the number of fatalities per 1,000 fires is similar.
According to the reports from the years 2002 - 2018 the average number of fire-related yearly deaths is 1. The highest number of deaths - 4 took place in 2009, and the lowest - 0 in 2002. The data has a constant trend.
The average number of deaths per 1,000 fires is 2. This indicator was the highest - 8 in 2009, and the lowest 0 in 2002. The trend for deaths per 1,000 incidents is constant. Compared to the state value the number of fatalities per 1,000 fires is similar.Deaths per 1,000 incidents in Lima, OH compared to nearest cities:
(Note: Based on data for all years, including only cities with at least 2,500 fire incidents)
| Lima: | 1.9 |
| Sidney: | 4.1 |
 According to the data from the years 2002 - 2018 the average number of fire-related yearly casualties is 10. The highest number of casualties - 18 took place in 2008, and the lowest - 2 in 2013. The data has a declining trend.
The average number of injuries per 1,000 fire incidents is 25. This indicator was the highest - 63 in 2002, and the lowest 6 in 2013. The trend for injuries per 1,000 incidents is decreasing. Compared to the Ohio value the number of casualties per 1,000 incidents is higher.
According to the data from the years 2002 - 2018 the average number of fire-related yearly casualties is 10. The highest number of casualties - 18 took place in 2008, and the lowest - 2 in 2013. The data has a declining trend.
The average number of injuries per 1,000 fire incidents is 25. This indicator was the highest - 63 in 2002, and the lowest 6 in 2013. The trend for injuries per 1,000 incidents is decreasing. Compared to the Ohio value the number of casualties per 1,000 incidents is higher.
 31.8% incidents where reported in the morning and 68.2% in the evening. The most fires (14.9%) took place on Sunday, and the least (13.6%) on Friday.
 Based on the 7,186 reports from years 2002 - 2018 most fires (10.6%) took place during July, and the least (5.8%) in February.
 Out of all 45,149 cases reported during the years 2002 - 2018, the most belonged to the categories: Rescue & EMS (52.0%), Fire (15.9%), and Hazardous Condition (11.6%).
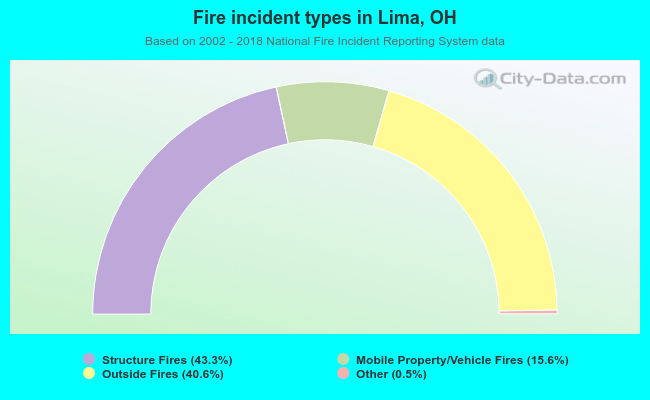 When looking into fire subcategories, the most reports belonged to: Structure Fires (43.3%), and Outside Fires (40.6%).