Kokomo: Fire Incidents, Indiana (IN)
Where are fire incidents reported in Kokomo, IN
Something went wrong! Please refresh the page.
| Fire incidents reported | |
|---|---|
| Sreet name | Count |
| WASHINGTON ST | 220 |
| JEFFERSON ST | 176 |
| 300 | 150 |
| 200 | 136 |
| MARKLAND AVE | 130 |
| MAIN ST | 128 |
| WEBSTER ST | 126 |
| APPERSON WAY | 120 |
| 400 | 118 |
| 100 | 104 |
| SYCAMORE ST | 104 |
| REED RD | 94 |
| UNION ST | 90 |
| WALNUT ST | 88 |
| LAFOUNTAIN ST | 84 |
| OHIO ST | 84 |
| PURDUM ST | 84 |
| TAYLOR ST | 84 |
| BELL ST | 82 |
| MONROE ST | 78 |
| DIXON RD | 76 |
| BUCKEYE ST | 72 |
| MARKET ST | 72 |
| MULBERRY ST | 72 |
| LOCKE ST | 70 |
| BOULEVARD | 66 |
| NORTH ST | 66 |
| VAILE AVE | 62 |
| 00 | 60 |
| ARMSTRONG ST | 60 |
| Other | 1,113 |
2002 - 2017 National Fire Incident Reporting System (NFIRS) incidents
- Incident types reported to NFIRS in Kokomo, IN
- 6,03140.7%Rescue & EMS
- 4,06927.5%Fire
- 2,44816.5%Hazardous Condition
- 9486.4%False Alarm
- 7475.0%Good Intent Call
- 5023.4%Service Call
- 320.2%Special Incident
- 250.2%Overpressure Rupture
- Fire incident types reported to NFIRS in Kokomo, IN
- 1,78043.7%Outside Fires
- 1,47136.2%Structure Fires
- 52312.9%Mobile Property/Vehicle Fires
- 2957.2%Other
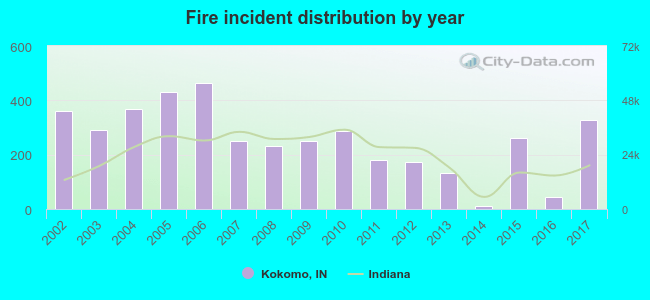 Based on the data from the years 2002 - 2017 the average number of fire incidents per year is 254. The highest number of reported fires - 465 took place in 2006, and the least - 10 in 2014. The data has a dropping trend.
The average number of yearly fire incidents per 10k residents in Kokomo, IN compared to nearest cities:
(Note: Based on data for the last 3 years, including only cities with population 5,000 and above)
| Kokomo: | 21.9 |
| Tipton: | 89.2 |
| Peru: | 4.5 |
| Elwood: | 24.8 |
| Logansport: | 29.1 |
| Frankfort: | 19.8 |
| Marion: | 53.6 |
| Wabash: | 40.9 |
| Gas City: | 58.0 |
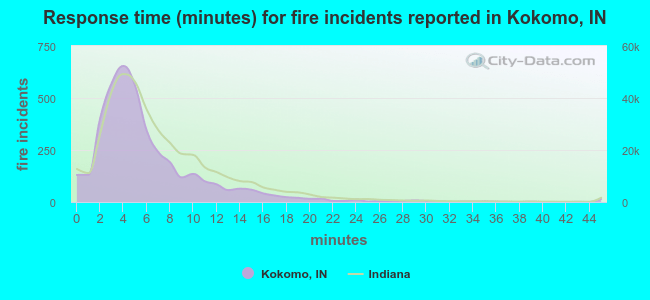 The median response time based on all reported fire incidents is 5 minutes. This is lower compared to the state median value.
The median response time in Kokomo, IN compared to nearest cities:
(Note: Based on data for all years, including only cities with at least 500 fire incidents)
| Kokomo: | 5 minutes |
| Greentown: | 10 minutes |
| Tipton: | 5 minutes |
| Peru: | 5 minutes |
| Elwood: | 3 minutes |
| Logansport: | 4 minutes |
| Frankfort: | 6 minutes |
| Sheridan: | 8 minutes |
| Marion: | 4 minutes |
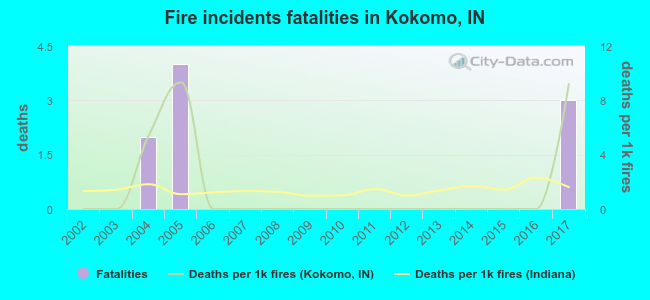 According to the reports from the years 2002 - 2017 the average number of fire-related yearly deaths is 1. The highest number of deaths - 4 took place in 2005, and the lowest - 0 in 2002. The data has an increasing trend.
The average number of fatalities per 1,000 fire incidents is 1. This indicator was the highest - 9 in 2005, and the lowest 0 in 2002. The trend for deaths per 1,000 fires is increasing. Compared to the Indiana value the number of deaths per 1,000 fire incidents is higher.
According to the reports from the years 2002 - 2017 the average number of fire-related yearly deaths is 1. The highest number of deaths - 4 took place in 2005, and the lowest - 0 in 2002. The data has an increasing trend.
The average number of fatalities per 1,000 fire incidents is 1. This indicator was the highest - 9 in 2005, and the lowest 0 in 2002. The trend for deaths per 1,000 fires is increasing. Compared to the Indiana value the number of deaths per 1,000 fire incidents is higher.Deaths per 1,000 incidents in Kokomo, IN compared to nearest cities:
(Note: Based on data for all years, including only cities with at least 2,500 fire incidents)
| Kokomo: | 2.2 |
| Marion: | 0.6 |
| Noblesville: | 0.8 |
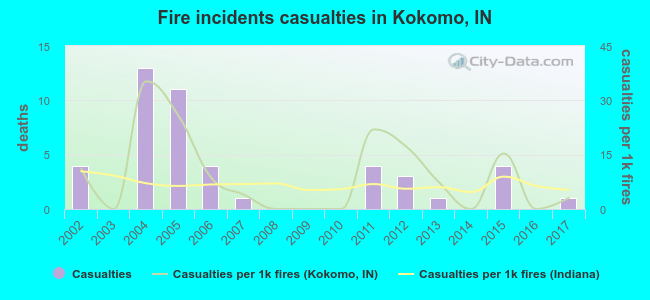 According to the reports from the years 2002 - 2017 the average number of fire-related casualties per year is 3. The highest number of reported injuries - 13 took place in 2004, and the lowest - 0 in 2003. The data has a declining trend.
The average number of injuries per 1,000 fire incidents is 9. This indicator was the highest - 35 in 2004, and the lowest 0 in 2003. The trend for injuries per 1,000 fire incidents is dropping. Compared to the state value the number of injuries per 1,000 incidents is higher.
According to the reports from the years 2002 - 2017 the average number of fire-related casualties per year is 3. The highest number of reported injuries - 13 took place in 2004, and the lowest - 0 in 2003. The data has a declining trend.
The average number of injuries per 1,000 fire incidents is 9. This indicator was the highest - 35 in 2004, and the lowest 0 in 2003. The trend for injuries per 1,000 fire incidents is dropping. Compared to the state value the number of injuries per 1,000 incidents is higher.
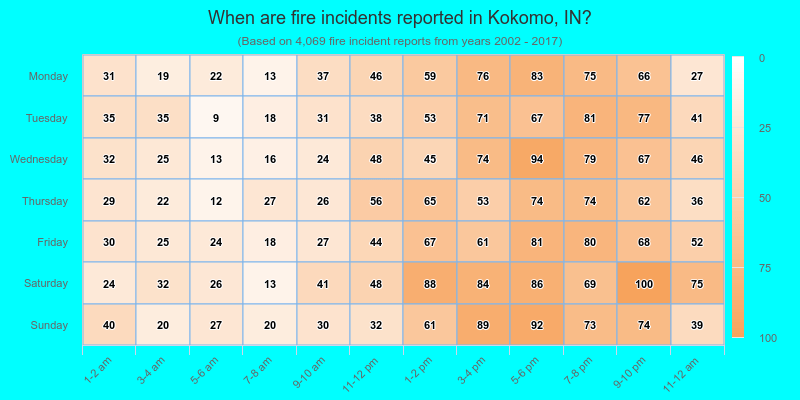
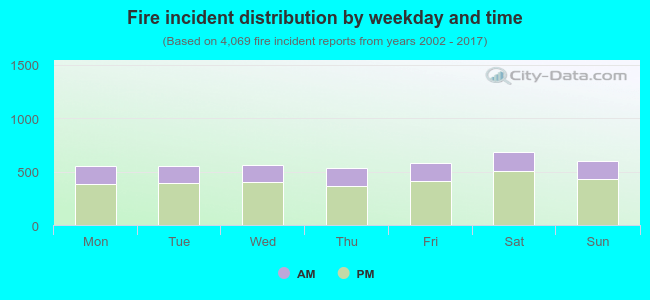 29.1% incidents where reported in the morning and 70.9% in the evening. The most fires (16.9%) took place on Saturday, and the least (13.2%) on Thursday.
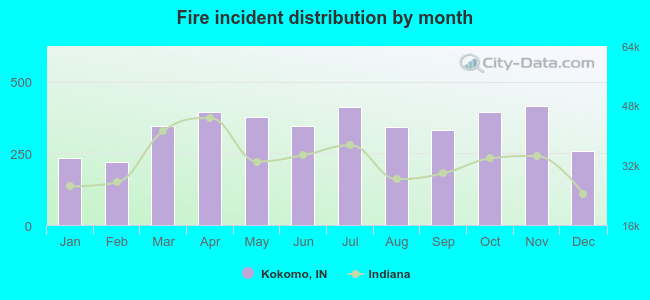 According to the 4,069 incident reports from years 2002 - 2017 most fires (10.2%) took place during November, and the least (5.4%) in February.
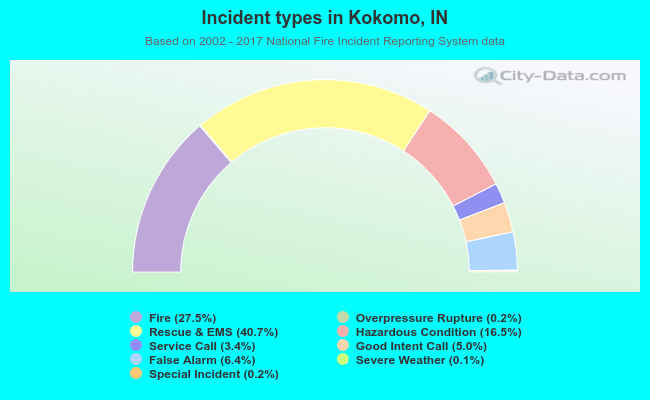 Out of all 14,812 cases reported during the years 2002 - 2017, the most belonged to the categories: Rescue & EMS (40.7%), Fire (27.5%), and Hazardous Condition (16.5%).
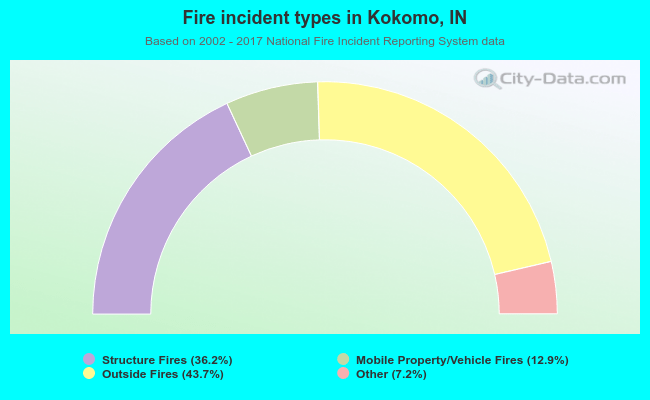 When looking into fire subcategories, the most reports belonged to: Outside Fires (43.7%), and Structure Fires (36.2%).