La Porte: Fire Incidents, Indiana (IN)
Where are fire incidents reported in La Porte, IN
Something went wrong! Please refresh the page.
| Fire incidents reported | |
|---|---|
| Sreet name | Count |
| LINCOLNWAY | 196 |
| PINE LAKE AVE | 76 |
| JEFFERSON AVE | 74 |
| BOYD BLVD | 70 |
| STATE ROAD 2 HWY | 62 |
| ANDREW AVE | 58 |
| MONROE ST | 54 |
| MICHIGAN AVE | 48 |
| 500 | 44 |
| BRIGHTON ST | 44 |
| STATE ST | 44 |
| MCCLUNG RD | 42 |
| MAPLE AVE | 40 |
| US HWY 20 | 40 |
| STATE ROAD 2 | 38 |
| WASHINGTON ST | 38 |
| COUNTRY LANE DR | 36 |
| INDIANA AVE | 34 |
| 18TH ST | 30 |
| WAVERLY RD | 30 |
| PHILADELPHIA ST | 28 |
| SR 39 | 28 |
| CLAY ST | 24 |
| WELLER AVE | 24 |
| WILHELM RD | 24 |
| GROVE ST | 22 |
| I ST | 22 |
| OHIO ST | 22 |
| 425 RD | 20 |
| BOSTON ST | 20 |
| Other | 232 |
2002 - 2018 National Fire Incident Reporting System (NFIRS) incidents
- Incident types reported to NFIRS in La Porte, IN
- 5,16154.3%Rescue & EMS
- 1,56416.5%Fire
- 1,07211.3%Hazardous Condition
- 6997.4%Good Intent Call
- 5515.8%False Alarm
- 3994.2%Service Call
- 220.2%Severe Weather
- 180.2%Special Incident
- 130.1%Overpressure Rupture
- Fire incident types reported to NFIRS in La Porte, IN
- 57636.8%Outside Fires
- 52933.8%Structure Fires
- 29118.6%Mobile Property/Vehicle Fires
- 16810.7%Other
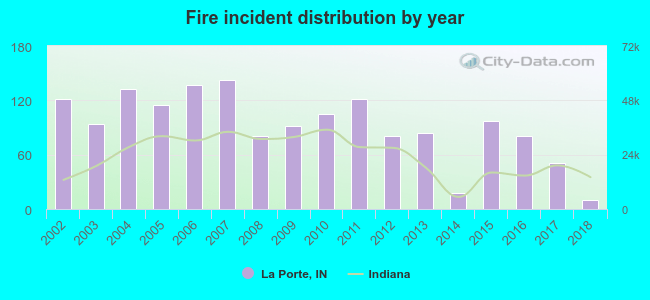 Based on the data from the years 2002 - 2018 the average number of fires per year is 92. The highest number of reported fire incidents - 143 took place in 2007, and the least - 10 in 2018. The data has a decreasing trend.
The average number of yearly fire incidents per 10k residents in La Porte, IN compared to nearest cities:
(Note: Based on data for the last 3 years, including only cities with population 5,000 and above)
| La Porte: | 21.5 |
| Westville: | 23.5 |
| Michigan City: | 40.5 |
| Chesterton: | 21.4 |
| Valparaiso: | 30.9 |
| South Haven: | 8.5 |
| South Bend: | 26.3 |
| Portage: | 16.1 |
| Notre Dame: | 36.8 |
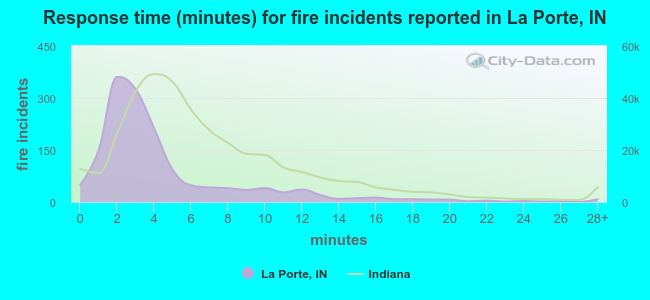 The median response time based on all reported fire incidents is 3 minutes. This is much lower than the Indiana median value.
The median response time in La Porte, IN compared to nearest cities:
(Note: Based on data for all years, including only cities with at least 500 fire incidents)
| La Porte: | 3 minutes |
| Michigan City: | 5 minutes |
| Walkerton: | 8 minutes |
| Chesterton: | 6 minutes |
| Valparaiso: | 6 minutes |
| Knox: | 7 minutes |
| South Bend: | 5 minutes |
| Portage: | 6 minutes |
| Notre Dame: | 2 minutes |
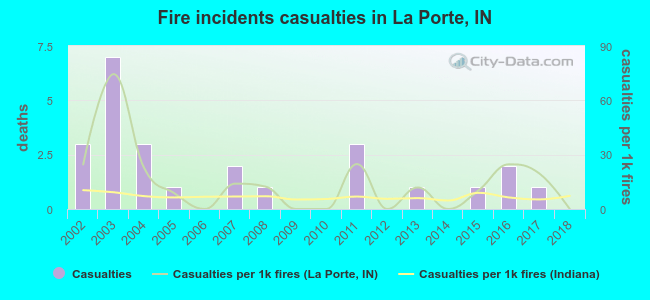 Based on the reports from the years 2002 - 2018 the average number of fire-related casualties per year is 1. The highest number of injuries - 7 took place in 2003, and the lowest - 0 in 2006. The data has a decreasing trend.
The average number of casualties per 1,000 fires is 15. This indicator was the highest - 74 in 2003, and the lowest 0 in 2006. The trend for injuries per 1,000 fires is declining. Compared to the state value the number of injuries per 1,000 fires is much higher.
Based on the reports from the years 2002 - 2018 the average number of fire-related casualties per year is 1. The highest number of injuries - 7 took place in 2003, and the lowest - 0 in 2006. The data has a decreasing trend.
The average number of casualties per 1,000 fires is 15. This indicator was the highest - 74 in 2003, and the lowest 0 in 2006. The trend for injuries per 1,000 fires is declining. Compared to the state value the number of injuries per 1,000 fires is much higher.Casualties per 1,000 incidents in La Porte, IN compared to nearest cities:
(Note: Based on data for all years, including only cities with at least 500 fire incidents)
| La Porte: | 16.0 |
| Michigan City: | 1.3 |
| Walkerton: | 7.1 |
| Chesterton: | 1.6 |
| Valparaiso: | 5.0 |
| Knox: | 2.2 |
| South Bend: | 2.2 |
| Portage: | 12.3 |
| Notre Dame: | 14.6 |
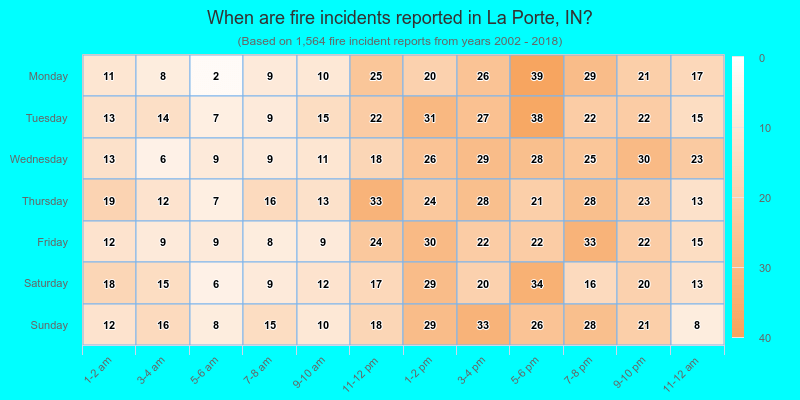
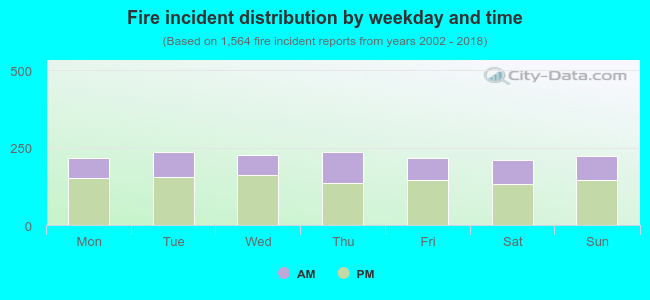 34.4% incidents where reported in the morning and 65.6% in the evening. The most fires (15.2%) took place on Thursday, and the least (13.4%) on Saturday.
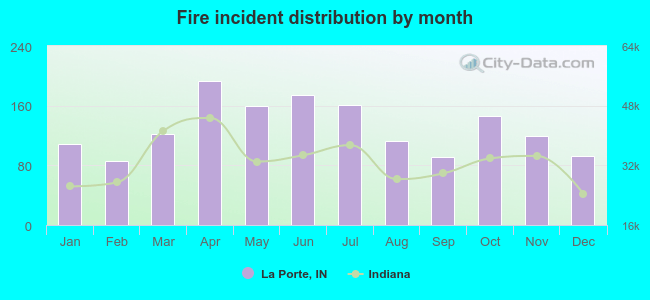 According to the 1,564 fire incident reports from years 2002 - 2018 most fires (12.3%) took place during April, and the least (5.5%) in February.
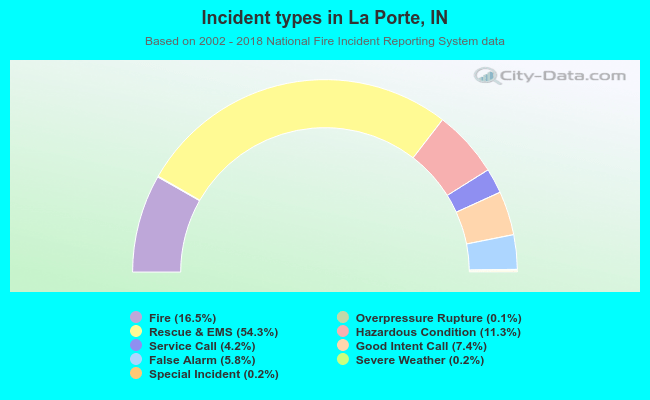 Out of all 9,499 cases reported during the years 2002 - 2018, the most belonged to the categories: Rescue & EMS (54.3%), Fire (16.5%), and Hazardous Condition (11.3%).
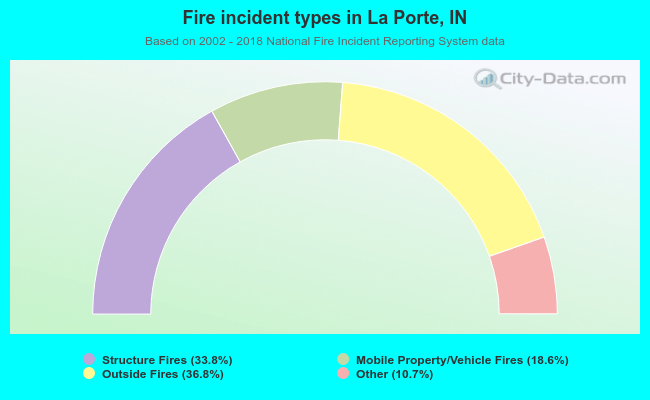 When looking into fire subcategories, the most reports belonged to: Outside Fires (36.8%), and Structure Fires (33.8%).