Valparaiso: Fire Incidents, Indiana (IN)
Where are fire incidents reported in Valparaiso, IN
Something went wrong! Please refresh the page.
| Fire incidents reported | |
|---|---|
| Sreet name | Count |
| CALUMET AVE | 122 |
| 100 RD | 80 |
| MORTHLAND DR | 78 |
| DIVISION RD | 74 |
| LINCOLNWAY ST | 52 |
| 500 RD | 50 |
| 700 | 50 |
| CHICAGO ST | 44 |
| U. S. 6 HWY | 42 |
| BEECH ST | 38 |
| LAPORTE AVE | 38 |
| 200 RD | 32 |
| 600 | 32 |
| EVANS AVE | 32 |
| INDIANA AVE | 32 |
| JUNIPER RD | 32 |
| STURDY RD | 32 |
| 600 RD | 30 |
| CAMPBELL ST | 30 |
| GLENDALE BLVD | 30 |
| LINCOLNWAY | 28 |
| ROOSEVELT RD | 28 |
| SILHAVY RD | 28 |
| 700 NORTH | 26 |
| VALE PARK RD | 26 |
| VALPARAISO ST | 26 |
| 700 RD | 24 |
| FRANKLIN ST | 24 |
| MORTHLAND | 24 |
| US HIGHWAY 6 HWY | 24 |
| Other | 1,573 |
2002 - 2017 National Fire Incident Reporting System (NFIRS) incidents
- Incident types reported to NFIRS in Valparaiso, IN
- 11,90354.9%Rescue & EMS
- 2,78112.8%Fire
- 2,59612.0%Hazardous Condition
- 1,6867.8%Service Call
- 1,3506.2%Good Intent Call
- 1,2575.8%False Alarm
- 550.3%Special Incident
- 350.2%Overpressure Rupture
- Fire incident types reported to NFIRS in Valparaiso, IN
- 1,16241.8%Outside Fires
- 94133.8%Structure Fires
- 42015.1%Mobile Property/Vehicle Fires
- 2589.3%Other
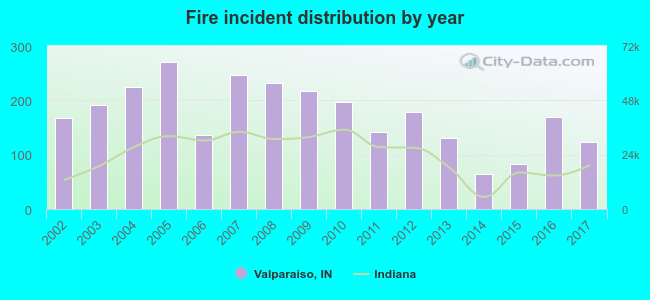 According to the data from the years 2002 - 2017 the average number of fire incidents per year is 173. The highest number of reported fires - 271 took place in 2005, and the least - 64 in 2014. The data has a dropping trend.
The average number of yearly fire incidents per 10k residents in Valparaiso, IN compared to nearest cities:
(Note: Based on data for the last 3 years, including only cities with population 5,000 and above)
| Valparaiso: | 30.9 |
| South Haven: | 8.5 |
| Chesterton: | 21.4 |
| Westville: | 23.5 |
| Portage: | 16.1 |
| Hobart: | 1.4 |
| Lake Station: | 22.2 |
| Merrillville: | 23.5 |
| Crown Point: | 18.9 |
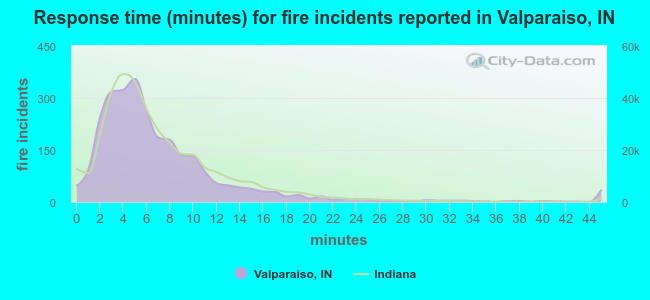 The median response time based on all reported fire incidents is 6 minutes. This is close to the state median value.
The median response time in Valparaiso, IN compared to nearest cities:
(Note: Based on data for all years, including only cities with at least 500 fire incidents)
| Valparaiso: | 6 minutes |
| Chesterton: | 6 minutes |
| Portage: | 6 minutes |
| Hobart: | 5 minutes |
| Lake Station: | 7 minutes |
| Hebron: | 9 minutes |
| Merrillville: | 5 minutes |
| Crown Point: | 6 minutes |
| Gary: | 5 minutes |
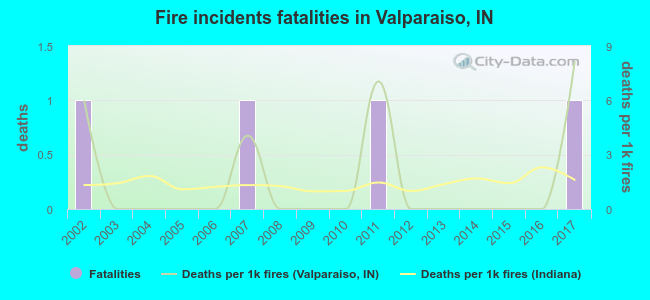 Based on the reports from the years 2002 - 2017 the average number of fire-related yearly deaths is 0. The highest number of deaths - 1 took place in 2002, and the lowest - 0 in 2003. The data has a constant trend.
The average number of fatalities per 1,000 fire incidents is 2. This indicator was the highest - 8 in 2017, and the lowest 0 in 2003. The trend for deaths per 1,000 fires is rising. Compared to the Indiana value the number of fatalities per 1,000 fires is about the same.
Based on the reports from the years 2002 - 2017 the average number of fire-related yearly deaths is 0. The highest number of deaths - 1 took place in 2002, and the lowest - 0 in 2003. The data has a constant trend.
The average number of fatalities per 1,000 fire incidents is 2. This indicator was the highest - 8 in 2017, and the lowest 0 in 2003. The trend for deaths per 1,000 fires is rising. Compared to the Indiana value the number of fatalities per 1,000 fires is about the same.Deaths per 1,000 incidents in Valparaiso, IN compared to nearest cities:
(Note: Based on data for all years, including only cities with at least 2,500 fire incidents)
| Valparaiso: | 1.4 |
| Gary: | 0.6 |
| Michigan City: | 1.9 |
| Hammond: | 1.4 |
| Calumet City: | 2.5 |
| Dolton: | 0.6 |
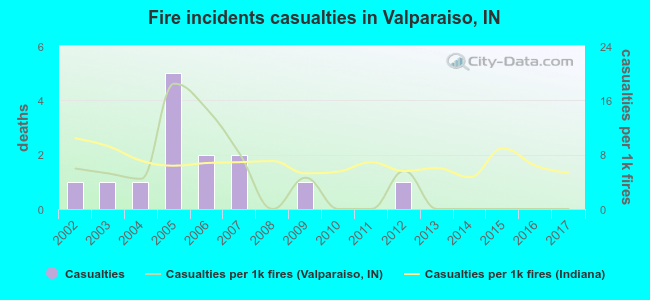 Based on the data from the years 2002 - 2017 the average number of fire-related casualties per year is 1. The highest number of casualties - 5 took place in 2005, and the lowest - 0 in 2008. The data has a decreasing trend.
The average number of casualties per 1,000 fires is 4. This indicator was the highest - 18 in 2005, and the lowest 0 in 2008. The trend for casualties per 1,000 incidents is dropping. Compared to the state value the number of casualties per 1,000 fire incidents is lower.
Based on the data from the years 2002 - 2017 the average number of fire-related casualties per year is 1. The highest number of casualties - 5 took place in 2005, and the lowest - 0 in 2008. The data has a decreasing trend.
The average number of casualties per 1,000 fires is 4. This indicator was the highest - 18 in 2005, and the lowest 0 in 2008. The trend for casualties per 1,000 incidents is dropping. Compared to the state value the number of casualties per 1,000 fire incidents is lower.Casualties per 1,000 incidents in Valparaiso, IN compared to nearest cities:
(Note: Based on data for all years, including only cities with at least 500 fire incidents)
| Valparaiso: | 5.0 |
| Chesterton: | 1.6 |
| Portage: | 12.3 |
| Hobart: | 16.3 |
| Lake Station: | 1.9 |
| Hebron: | 0.0 |
| Merrillville: | 6.6 |
| Crown Point: | 1.4 |
| Gary: | 2.4 |
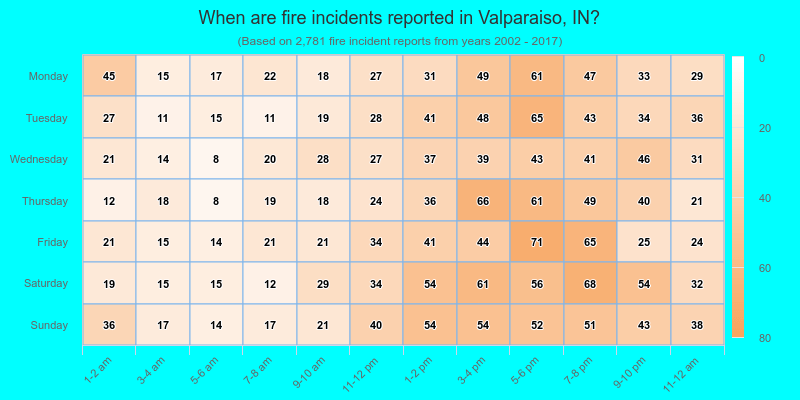
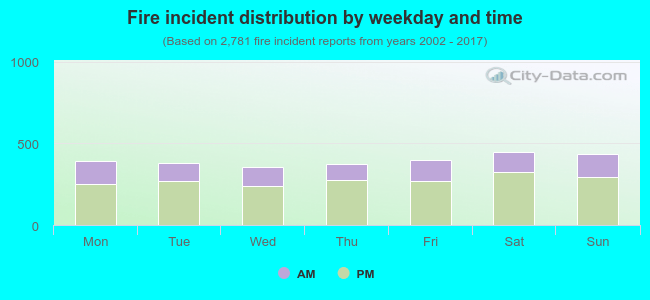 31.2% incidents where reported in the morning and 68.8% in the evening. The most fires (16.1%) took place on Saturday, and the least (12.8%) on Wednesday.
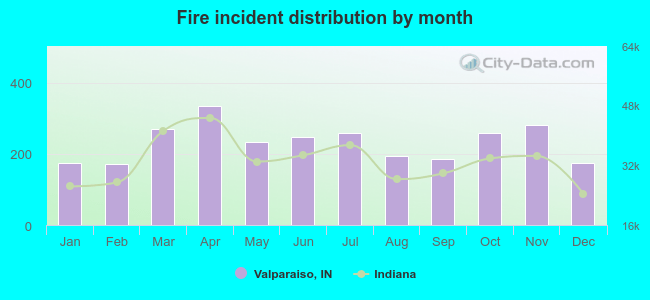 According to the 2,781 fires from years 2002 - 2017 most fires (12.0%) took place during April, and the least (6.1%) in February.
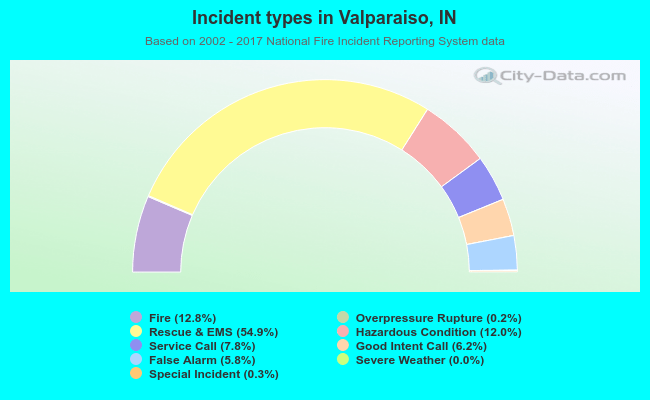 Out of all 21,671 cases reported during the years 2002 - 2017, the most belonged to the categories: Rescue & EMS (54.9%), Fire (12.8%), and Hazardous Condition (12.0%).
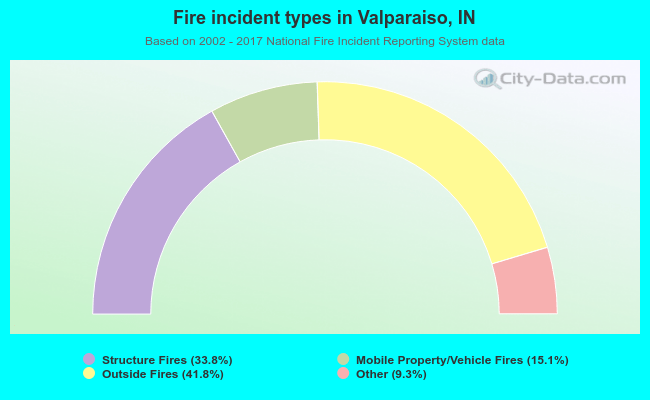 When looking into fire subcategories, the most reports belonged to: Outside Fires (41.8%), and Structure Fires (33.8%).