Michigan City: Fire Incidents, Indiana (IN)
Where are fire incidents reported in Michigan City, IN
Something went wrong! Please refresh the page.
| Fire incidents reported | |
|---|---|
| Sreet name | Count |
| FRANKLIN ST | 338 |
| MICHIGAN BLVD | 212 |
| US HWY 20 | 176 |
| 400 | 116 |
| JOHNSON RD | 104 |
| US HWY 12 | 100 |
| 10TH ST | 98 |
| 8TH ST | 96 |
| PINETREE CT | 92 |
| OHIO ST | 76 |
| STATE RD 212 | 74 |
| 9TH ST | 72 |
| 600 | 70 |
| 300 | 68 |
| MANHATTAN ST | 66 |
| SPRINGLAND AVE | 56 |
| WABASH ST | 56 |
| ELSTON ST | 54 |
| LAKE SHORE DR | 54 |
| WOODS EDGE DR | 54 |
| NORMANDY DR | 52 |
| WOODLAND AVE | 52 |
| WOZNIAK RD | 52 |
| 11TH ST | 50 |
| KARWICK RD | 50 |
| 450 | 48 |
| CARROLL AVE | 48 |
| 1000 | 44 |
| COOLSPRING AVE | 44 |
| BARKER AVE | 42 |
| Other | 1,227 |
2002 - 2017 National Fire Incident Reporting System (NFIRS) incidents
- Incident types reported to NFIRS in Michigan City, IN
- 5,41237.4%Rescue & EMS
- 3,74125.8%Fire
- 1,93213.3%Hazardous Condition
- 1,70211.7%Good Intent Call
- 1,1908.2%False Alarm
- 4323.0%Service Call
- 370.3%Overpressure Rupture
- 300.2%Special Incident
- Fire incident types reported to NFIRS in Michigan City, IN
- 1,43238.3%Outside Fires
- 1,24433.3%Structure Fires
- 73619.7%Mobile Property/Vehicle Fires
- 3298.8%Other
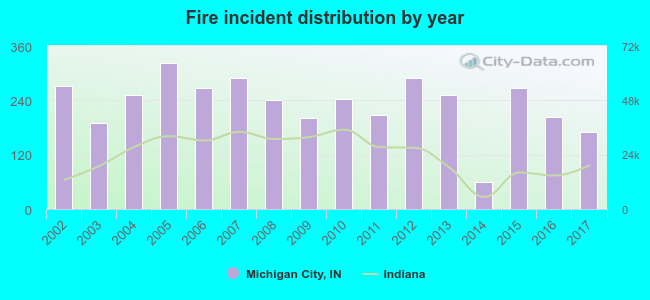 Based on the data from the years 2002 - 2017 the average number of fires per year is 233. The highest number of fire incidents - 323 took place in 2005, and the least - 60 in 2014. The data has a dropping trend.
The average number of yearly fire incidents per 10k residents in Michigan City, IN compared to nearest cities:
(Note: Based on data for the last 3 years, including only cities with population 5,000 and above)
| Michigan City: | 40.5 |
| La Porte: | 21.5 |
| Westville: | 23.5 |
| Chesterton: | 21.4 |
| South Haven: | 8.5 |
| Portage: | 16.1 |
| Valparaiso: | 30.9 |
| Lake Station: | 22.2 |
| Hobart: | 1.4 |
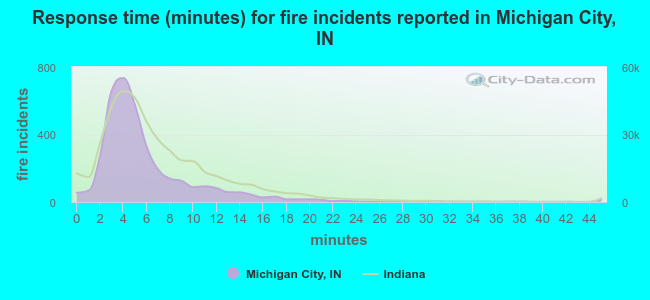 The median response time based on all reported fire incidents is 5 minutes. This is lower than the state median value.
The median response time in Michigan City, IN compared to nearest cities:
(Note: Based on data for all years, including only cities with at least 500 fire incidents)
| Michigan City: | 5 minutes |
| La Porte: | 3 minutes |
| Chesterton: | 6 minutes |
| Portage: | 6 minutes |
| Valparaiso: | 6 minutes |
| Lake Station: | 7 minutes |
| Hobart: | 5 minutes |
| Gary: | 5 minutes |
| Walkerton: | 8 minutes |
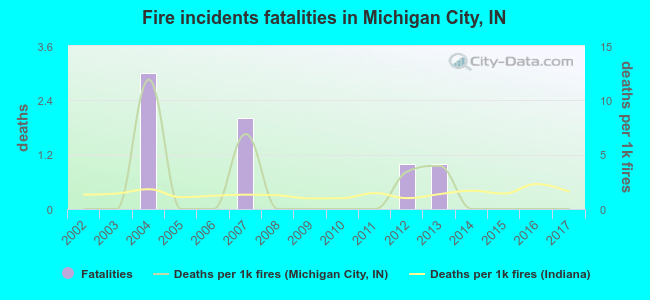 Based on the reports from the years 2002 - 2017 the average number of fire-related fatalities per year is 0. The highest number of reported deaths - 3 took place in 2004, and the lowest - 0 in 2002. The data has a constant trend.
The average number of fatalities per 1,000 fire incidents is 2. This indicator was the highest - 12 in 2004, and the lowest 0 in 2002. The trend for fatalities per 1,000 incidents is constant. Compared to the state value the number of fatalities per 1,000 fire incidents is higher.
Based on the reports from the years 2002 - 2017 the average number of fire-related fatalities per year is 0. The highest number of reported deaths - 3 took place in 2004, and the lowest - 0 in 2002. The data has a constant trend.
The average number of fatalities per 1,000 fire incidents is 2. This indicator was the highest - 12 in 2004, and the lowest 0 in 2002. The trend for fatalities per 1,000 incidents is constant. Compared to the state value the number of fatalities per 1,000 fire incidents is higher.Deaths per 1,000 incidents in Michigan City, IN compared to nearest cities:
(Note: Based on data for all years, including only cities with at least 2,500 fire incidents)
| Michigan City: | 1.9 |
| Valparaiso: | 1.4 |
| Gary: | 0.6 |
| Hammond: | 1.4 |
| South Bend: | 0.6 |
| Calumet City: | 2.5 |
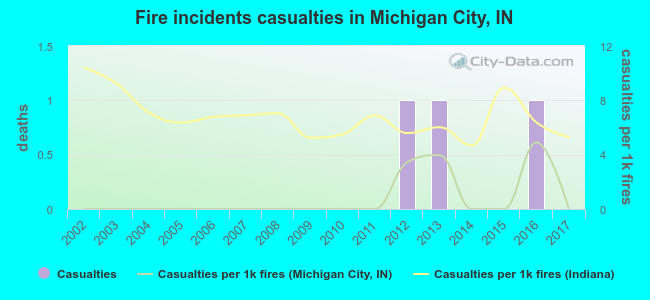 According to the reports from the years 2002 - 2017 the average number of fire-related casualties per year is 0. The highest number of reported casualties - 1 took place in 2012, and the lowest - 0 in 2002. The data has a constant trend.
The average number of casualties per 1,000 fire incidents is 1. This indicator was the highest - 5 in 2016, and the lowest 0 in 2002. The trend for casualties per 1,000 fires is constant. Compared to the Indiana value the number of injuries per 1,000 incidents is much lower.
According to the reports from the years 2002 - 2017 the average number of fire-related casualties per year is 0. The highest number of reported casualties - 1 took place in 2012, and the lowest - 0 in 2002. The data has a constant trend.
The average number of casualties per 1,000 fire incidents is 1. This indicator was the highest - 5 in 2016, and the lowest 0 in 2002. The trend for casualties per 1,000 fires is constant. Compared to the Indiana value the number of injuries per 1,000 incidents is much lower.Casualties per 1,000 incidents in Michigan City, IN compared to nearest cities:
(Note: Based on data for all years, including only cities with at least 500 fire incidents)
| Michigan City: | 1.3 |
| La Porte: | 16.0 |
| Chesterton: | 1.6 |
| Portage: | 12.3 |
| Valparaiso: | 5.0 |
| Lake Station: | 1.9 |
| Hobart: | 16.3 |
| Gary: | 2.4 |
| Walkerton: | 7.1 |
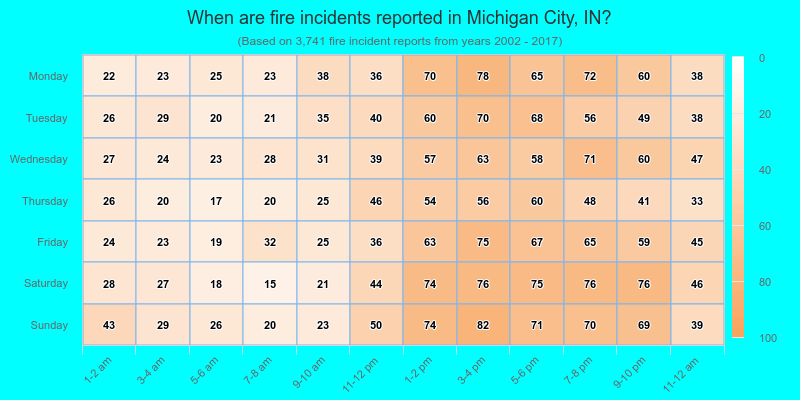
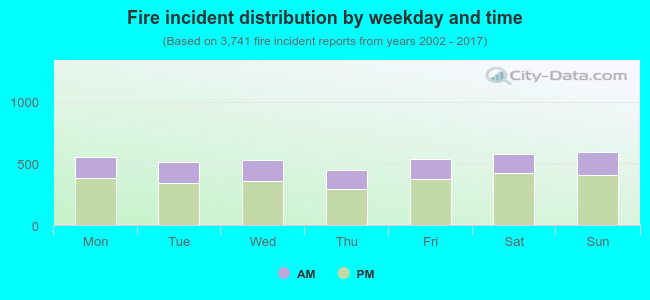 31.2% incidents where reported in the morning and 68.8% in the evening. The most fires (15.9%) took place on Sunday, and the least (11.9%) on Thursday.
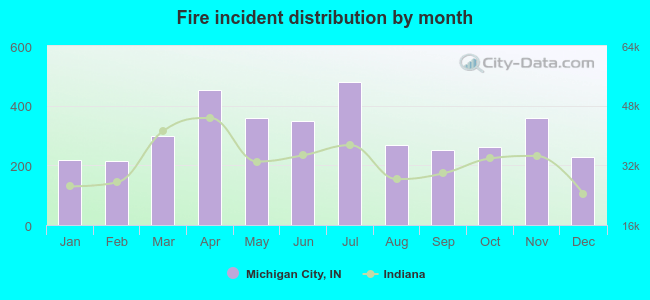 According to the 3,741 fires from years 2002 - 2017 most fires (12.9%) took place during July, and the least (5.8%) in February.
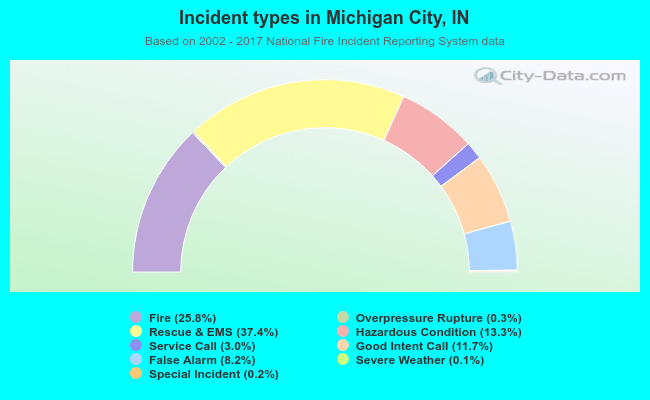 Out of all 14,489 cases reported during the years 2002 - 2017, the most belonged to the categories: Rescue & EMS (37.4%), Fire (25.8%), and Hazardous Condition (13.3%).
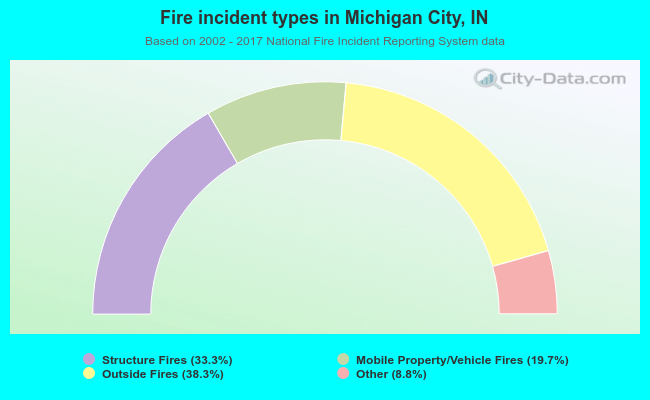 When looking into fire subcategories, the most reports belonged to: Outside Fires (38.3%), and Structure Fires (33.3%).