Lewisboro: Fire Incidents, New York (NY)
Where are fire incidents reported in Lewisboro, NY
Something went wrong! Please refresh the page.
|
| |||||||||||||||||||||||||||||||||||||||||||||||||||||||||||||||||||||||||||||||||||||||||||||||||||||||||||||
2005 - 2018 National Fire Incident Reporting System (NFIRS) incidents
- Incident types reported to NFIRS in Lewisboro, NY
- 73745.7%Rescue & EMS
- 25115.6%False Alarm
- 24114.9%Hazardous Condition
- 1479.1%Fire
- 1348.3%Service Call
- 1036.4%Good Intent Call
- Fire incident types reported to NFIRS in Lewisboro, NY
- 7651.7%Structure Fires
- 4631.3%Outside Fires
- 149.5%Mobile Property/Vehicle Fires
- 117.5%Other
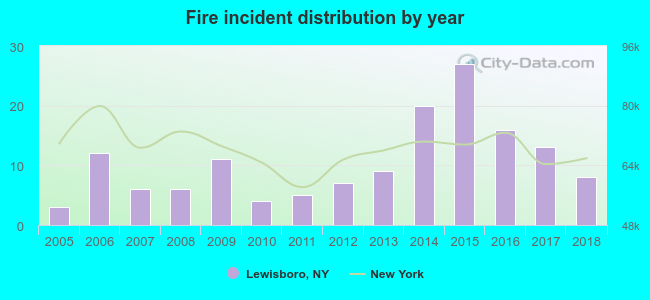 Based on the data from the years 2005 - 2018 the average number of fire incidents per year is 11. The highest number of reported fire incidents - 27 took place in 2015, and the least - 3 in 2005. The data has an increasing trend.
The average number of yearly fire incidents per 10k residents in Lewisboro, NY compared to nearest cities:
(Note: Based on data for the last 3 years, including only cities with population 5,000 and above)
| Lewisboro: | 9.9 |
| Pound Ridge: | 33.3 |
| North Salem: | 58.8 |
| Somers: | 9.8 |
| Mount Kisco: | 40.5 |
| Southeast: | 3.3 |
| Mahopac: | 131.4 |
| New Castle: | 1.1 |
| Carmel: | 19.4 |
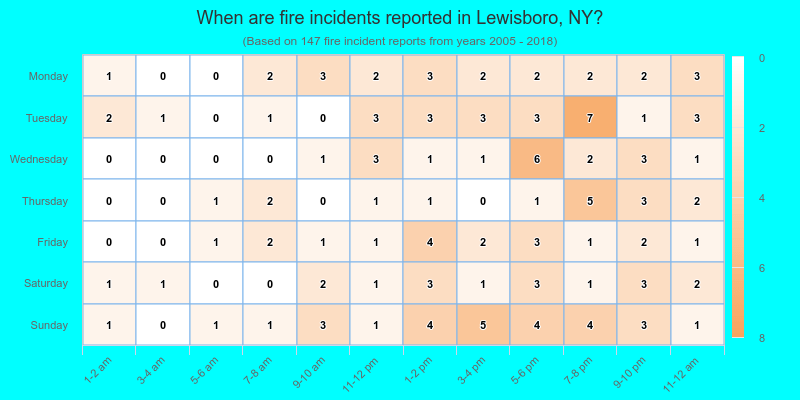
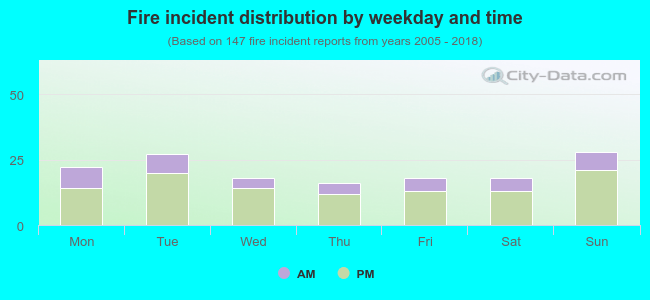 27.2% incidents where reported in the morning and 72.8% in the evening. The most fires (19.0%) took place on Sunday, and the least (10.9%) on Thursday.
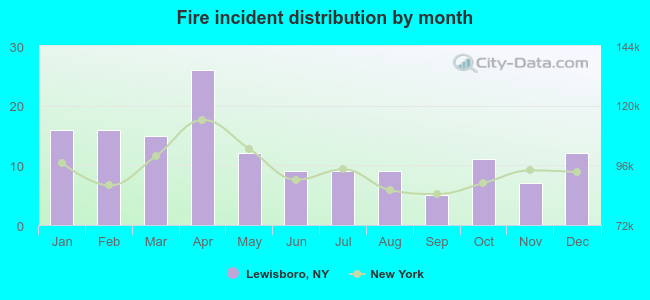 Based on the 147 fire incidents from years 2005 - 2018 most fires (17.7%) took place during April, and the least (3.4%) in September.
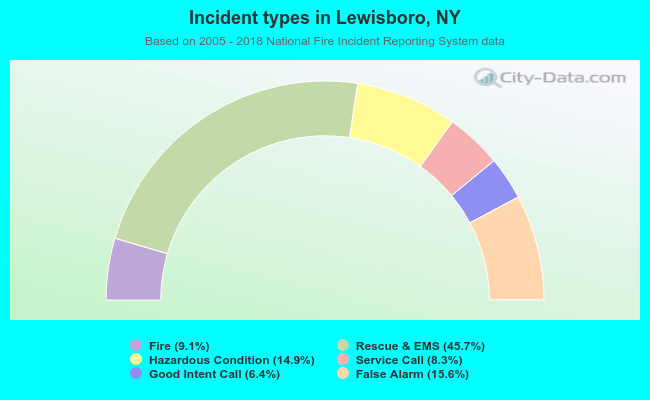 Out of all 1,613 cases reported during the years 2005 - 2018, the most belonged to the categories: Overpressure Rupture (45.7%), Good Intent Call (15.6%), and Rescue & EMS (14.9%).
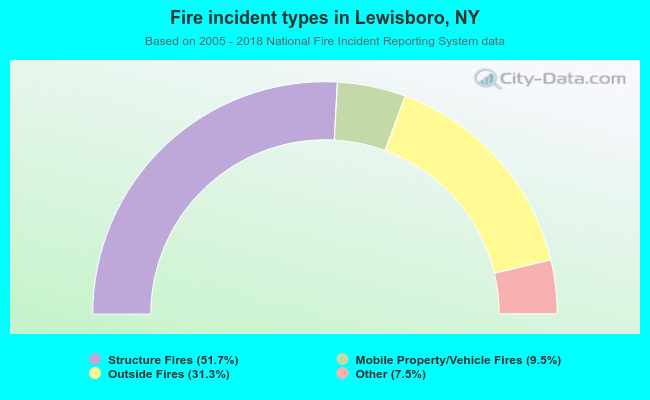 When looking into fire subcategories, the most incidents belonged to: Structure Fires (51.7%), and Outside Fires (31.3%).