North Salem: Fire Incidents, New York (NY)
Where are fire incidents reported in North Salem, NY
Something went wrong! Please refresh the page.
|
| |||||||||||||||||||||||||||||||||||||||||||||||||||||||||||||||||||||||||||||||||||||||||||||||||||||||||||||
2002 - 2018 National Fire Incident Reporting System (NFIRS) incidents
- Incident types reported to NFIRS in North Salem, NY
- 1,53743.7%Rescue & EMS
- 69919.9%False Alarm
- 49914.2%Hazardous Condition
- 3319.4%Fire
- 2717.7%Good Intent Call
- 1775.0%Service Call
- 40.1%Severe Weather
- Fire incident types reported to NFIRS in North Salem, NY
- 12638.1%Structure Fires
- 8826.6%Outside Fires
- 8224.8%Mobile Property/Vehicle Fires
- 3510.6%Other
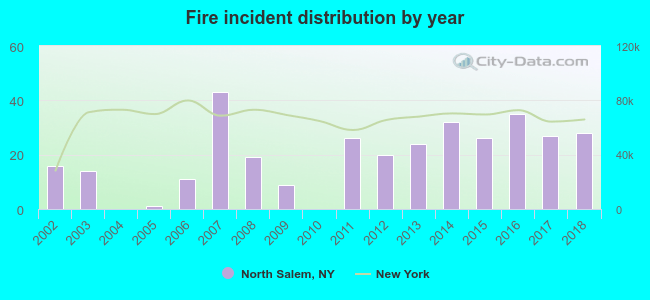 Based on the data from the years 2002 - 2018 the average number of fire incidents per year is 19. The highest number of reported fire incidents - 43 took place in 2007, and the least - 0 in 2004. The data has a growing trend.
The average number of yearly fire incidents per 10k residents in North Salem, NY compared to nearest cities:
(Note: Based on data for the last 3 years, including only cities with population 5,000 and above)
| North Salem: | 58.8 |
| Lewisboro: | 9.9 |
| Southeast: | 3.3 |
| Somers: | 9.8 |
| Mahopac: | 131.4 |
| Carmel: | 19.4 |
| Pound Ridge: | 33.3 |
| Lake Carmel: | 4.8 |
| Kent: | 14.3 |

 29.0% incidents where reported in the morning and 71.0% in the evening. The most fires (17.2%) took place on Wednesday, and the least (10.9%) on Friday.
 According to the 331 reports from years 2002 - 2018 most fires (10.6%) took place during July, and the least (5.7%) in January.
 Out of all 3,519 cases reported during the years 2002 - 2018, the most belonged to the categories: Overpressure Rupture (43.7%), Good Intent Call (19.9%), and Rescue & EMS (14.2%).
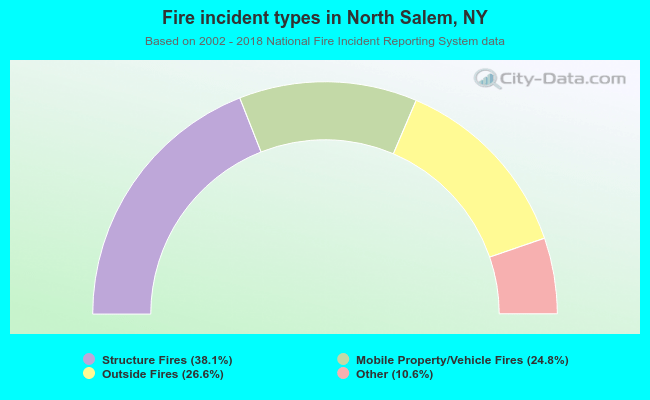 When looking into fire subcategories, the most incidents belonged to: Structure Fires (38.1%), and Outside Fires (26.6%).