Pound Ridge: Fire Incidents, New York (NY)
Where are fire incidents reported in Pound Ridge, NY
Something went wrong! Please refresh the page.
|
| |||||||||||||||||||||||||||||||||||||||||||||||||||||||||||||||||||||||||||||||||||||||||||||||||||||||||||||
2002 - 2018 National Fire Incident Reporting System (NFIRS) incidents
- Incident types reported to NFIRS in Pound Ridge, NY
- 90041.6%False Alarm
- 61128.2%Hazardous Condition
- 24911.5%Fire
- 1677.7%Rescue & EMS
- 1225.6%Good Intent Call
- 1095.0%Service Call
- 60.3%Severe Weather
- Fire incident types reported to NFIRS in Pound Ridge, NY
- 15361.4%Structure Fires
- 7128.5%Outside Fires
- 156.0%Mobile Property/Vehicle Fires
- 104.0%Other
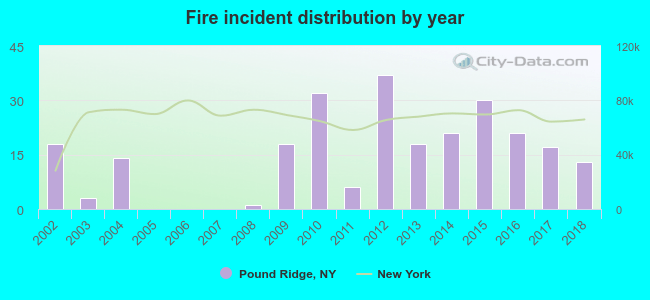 Based on the data from the years 2002 - 2018 the average number of fire incidents per year is 15. The highest number of fire incidents - 37 took place in 2012, and the least - 0 in 2005. The data has a dropping trend.
The average number of yearly fire incidents per 10k residents in Pound Ridge, NY compared to nearest cities:
(Note: Based on data for the last 3 years, including only cities with population 5,000 and above)
| Pound Ridge: | 33.3 |
| Lewisboro: | 9.9 |
| Mount Kisco: | 40.5 |
| North Salem: | 58.8 |
| North Castle: | 5.9 |
| New Castle: | 1.1 |
| Somers: | 9.8 |
| Pleasantville: | 6.3 |
| Yorktown: | 11.7 |

 27.7% incidents where reported in the morning and 72.3% in the evening. The most fires (16.9%) took place on Sunday, and the least (11.2%) on Tuesday.
 According to the 249 reports from years 2002 - 2018 most fires (13.3%) took place during November, and the least (3.6%) in September.
 Out of all 2,165 cases reported during the years 2002 - 2018, the most belonged to the categories: False Alarm (41.6%), Hazardous Condition (28.2%), and Fire (11.5%).
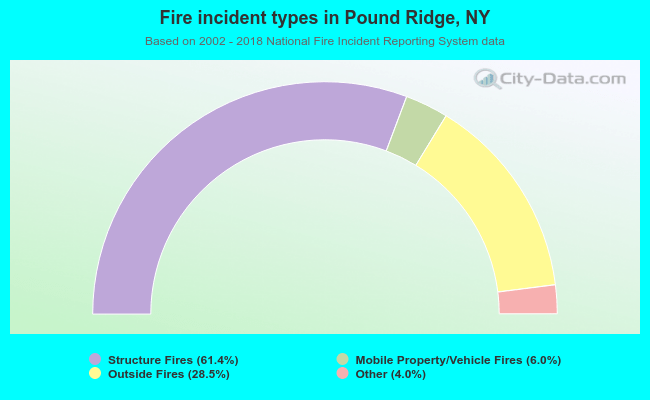 When looking into fire subcategories, the most incidents belonged to: Structure Fires (61.4%), and Outside Fires (28.5%).