High Point: Fire Incidents, North Carolina (NC)
Where are fire incidents reported in High Point, NC
Something went wrong! Please refresh the page.
| Fire incidents reported | |
|---|---|
| Sreet name | Count |
| MAIN ST | 438 |
| ELM ST | 122 |
| GREEN DR | 120 |
| CENTENNIAL ST | 104 |
| EASTCHESTER DR | 100 |
| FAIRFIELD RD | 98 |
| KIVETT DR | 94 |
| WESTCHESTER DR | 94 |
| BRENTWOOD ST | 90 |
| PARK ST | 74 |
| ENGLISH RD | 68 |
| HORNEYTOWN RD | 68 |
| SKEET CLUB RD | 66 |
| GREENSBORO RD | 62 |
| LEXINGTON AVE | 62 |
| JOHNSON ST | 58 |
| SAMET DR | 58 |
| COLLEGE DR | 54 |
| HIGH POINT RD | 54 |
| SHADOW VALLEY RD | 54 |
| ABBOTTS CREEK CHURCH RD | 48 |
| MCGUINN DR | 46 |
| GUYER ST | 44 |
| GORDON ST | 42 |
| PROSPECT ST | 40 |
| LINCOLN DR | 38 |
| HAMILTON ST | 36 |
| HARTLEY DR | 36 |
| SCIENTIFIC ST | 36 |
| SUFFOLK AVE | 36 |
| Other | 2,479 |
2002 - 2018 National Fire Incident Reporting System (NFIRS) incidents
- Incident types reported to NFIRS in High Point, NC
- 30,18559.8%Rescue & EMS
- 5,57411.0%False Alarm
- 4,8199.5%Fire
- 4,0598.0%Hazardous Condition
- 3,1656.3%Good Intent Call
- 2,4094.8%Service Call
- 1330.3%Severe Weather
- 870.2%Overpressure Rupture
- 570.1%Special Incident
- Fire incident types reported to NFIRS in High Point, NC
- 2,26347.0%Structure Fires
- 1,63033.8%Outside Fires
- 68114.1%Mobile Property/Vehicle Fires
- 2455.1%Other
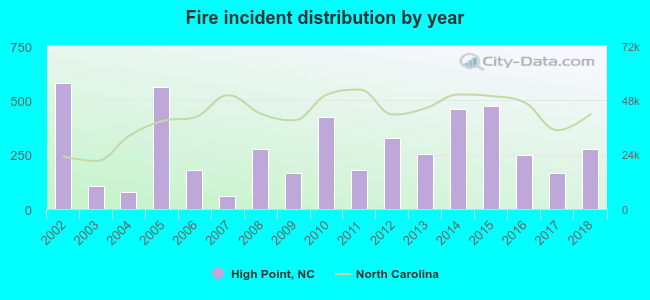 According to the data from the years 2002 - 2018 the average number of fires per year is 283. The highest number of reported fires - 582 took place in 2002, and the least - 62 in 2007. The data has a declining trend.
The average number of yearly fire incidents per 10k residents in High Point, NC compared to nearest cities:
(Note: Based on data for the last 3 years, including only cities with population 5,000 and above)
| High Point: | 21.2 |
| Archdale: | 54.0 |
| Trinity: | 78.1 |
| Thomasville: | 78.8 |
| Kernersville: | 86.2 |
| Greensboro: | 33.0 |
| Oak Ridge: | 30.8 |
| Summerfield: | 41.2 |
| Lexington: | 172.1 |
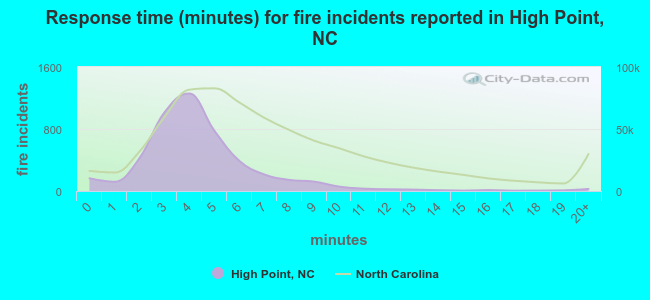 The median response time based on all reported fire incidents is 4 minutes. This is lower than the North Carolina median value.
The median response time in High Point, NC compared to nearest cities:
(Note: Based on data for all years, including only cities with at least 500 fire incidents)
| High Point: | 4 minutes |
| Jamestown: | 5 minutes |
| Archdale: | 5 minutes |
| Trinity: | 6 minutes |
| Thomasville: | 6 minutes |
| Kernersville: | 5 minutes |
| Greensboro: | 4 minutes |
| Pleasant Garden: | 6 minutes |
| Hampstead: | 8 minutes |
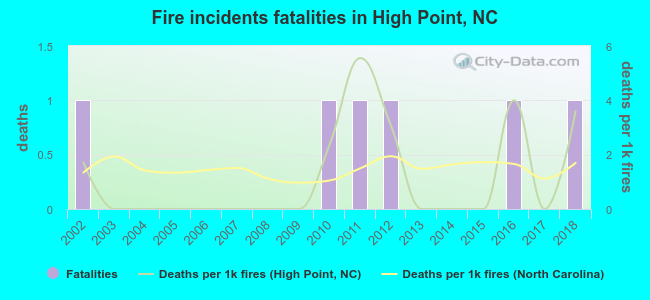 Based on the reports from the years 2002 - 2018 the average number of fire-related yearly deaths is 0. The highest number of reported deaths - 1 took place in 2002, and the lowest - 0 in 2003. The data has a constant trend.
The average number of fatalities per 1,000 fire incidents is 1. This indicator was the highest - 6 in 2011, and the lowest 0 in 2003. The trend for deaths per 1,000 fires is increasing. Compared to the state value the number of fatalities per 1,000 incidents is about the same.
Based on the reports from the years 2002 - 2018 the average number of fire-related yearly deaths is 0. The highest number of reported deaths - 1 took place in 2002, and the lowest - 0 in 2003. The data has a constant trend.
The average number of fatalities per 1,000 fire incidents is 1. This indicator was the highest - 6 in 2011, and the lowest 0 in 2003. The trend for deaths per 1,000 fires is increasing. Compared to the state value the number of fatalities per 1,000 incidents is about the same.Deaths per 1,000 incidents in High Point, NC compared to nearest cities:
(Note: Based on data for all years, including only cities with at least 2,500 fire incidents)
| High Point: | 1.2 |
| Thomasville: | 2.5 |
| Kernersville: | 1.1 |
| Greensboro: | 1.9 |
| Winston-Salem: | 2.1 |
| Lexington: | 0.0 |
| Asheboro: | 0.3 |
| Reidsville: | 2.9 |
| Burlington: | 2.0 |
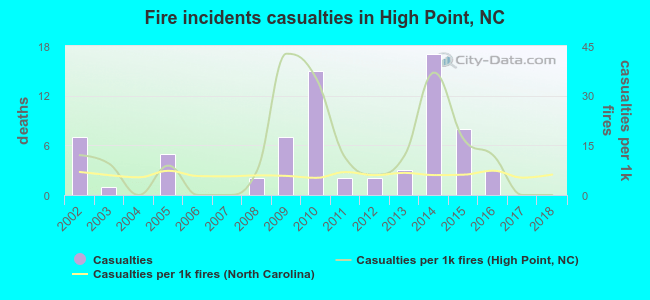 According to the reports from the years 2002 - 2018 the average number of fire-related yearly casualties is 4. The highest number of reported casualties - 17 took place in 2014, and the lowest - 0 in 2004. The data has a declining trend.
The average number of injuries per 1,000 fire incidents is 12. This indicator was the highest - 43 in 2009, and the lowest 0 in 2004. The trend for casualties per 1,000 fire incidents is dropping. Compared to the North Carolina value the number of casualties per 1,000 fires is much higher.
According to the reports from the years 2002 - 2018 the average number of fire-related yearly casualties is 4. The highest number of reported casualties - 17 took place in 2014, and the lowest - 0 in 2004. The data has a declining trend.
The average number of injuries per 1,000 fire incidents is 12. This indicator was the highest - 43 in 2009, and the lowest 0 in 2004. The trend for casualties per 1,000 fire incidents is dropping. Compared to the North Carolina value the number of casualties per 1,000 fires is much higher.Casualties per 1,000 incidents in High Point, NC compared to nearest cities:
(Note: Based on data for all years, including only cities with at least 500 fire incidents)
| High Point: | 14.9 |
| Jamestown: | 15.7 |
| Archdale: | 10.1 |
| Trinity: | 9.5 |
| Thomasville: | 3.0 |
| Kernersville: | 13.6 |
| Greensboro: | 12.2 |
| Pleasant Garden: | 4.2 |
| Hampstead: | 6.4 |
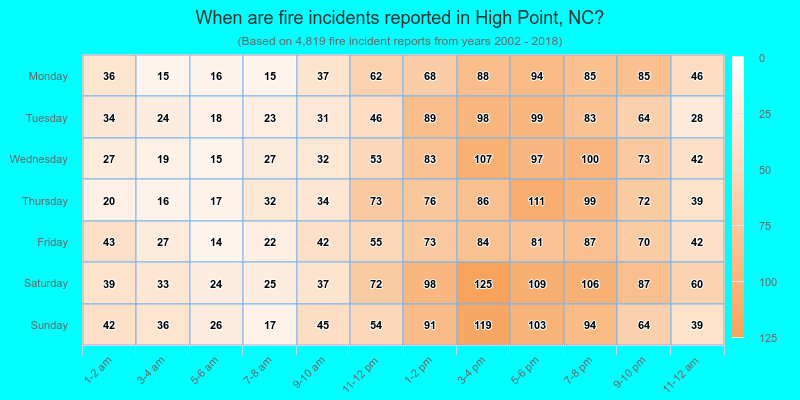
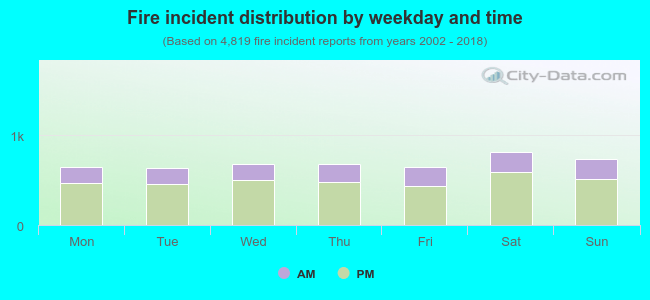 28.5% incidents where reported in the morning and 71.5% in the evening. The most fires (16.9%) took place on Saturday, and the least (13.2%) on Tuesday.
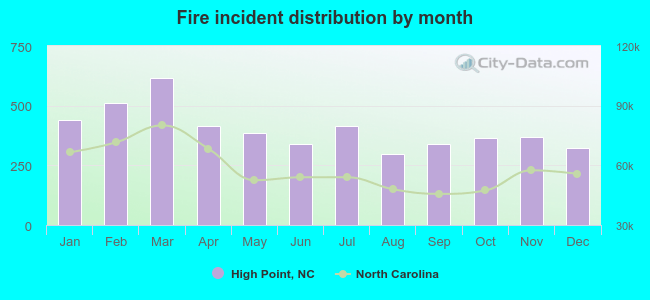 According to the 4,819 fires from years 2002 - 2018 most fires (12.8%) took place during March, and the least (6.2%) in August.
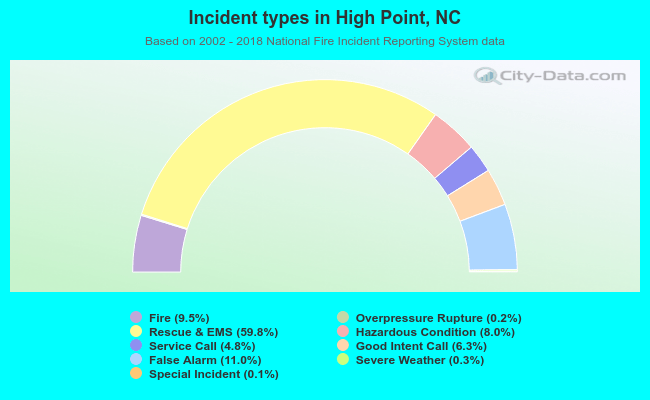 Out of all 50,488 cases reported during the years 2002 - 2018, the most belonged to the categories: Rescue & EMS (59.8%), False Alarm (11.0%), and Fire (9.5%).
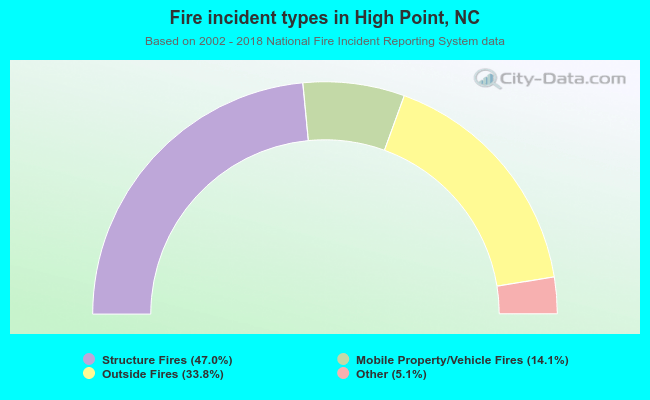 When looking into fire subcategories, the most reports belonged to: Structure Fires (47.0%), and Outside Fires (33.8%).