Liberty: Fire Incidents, Missouri (MO)
Where are fire incidents reported in Liberty, MO
Something went wrong! Please refresh the page.
| Fire incidents reported | |
|---|---|
| Sreet name | Count |
| 291 HWY | 72 |
| KANSAS ST | 58 |
| OLD 210 HWY | 50 |
| 210 HWY | 48 |
| H HWY | 46 |
| GLENN HENDREN DR | 36 |
| STEWART RD | 32 |
| BIRMINGHAM RD | 28 |
| FRANKLIN ST | 28 |
| HEARTLAND DR | 28 |
| RICHFIELD RD | 28 |
| MISSOURI CT | 26 |
| NEBO HILLS RD | 26 |
| WATER ST | 24 |
| CHURCH RD | 22 |
| GALLATIN ST | 22 |
| RUTH EWING RD | 22 |
| STILLHOUSE RD | 22 |
| A HWY | 20 |
| CHEROKEE DR | 20 |
| CLAYWOODS PKWY | 20 |
| BLUE JAY DR | 18 |
| CONISTOR ST | 18 |
| MISSOURI ST | 18 |
| SKYLINE DR | 18 |
| WITHERS RD | 18 |
| 35 HWY | 16 |
| B HWY | 16 |
| COLLEGE ST | 16 |
| DOGWOOD ST | 16 |
| Other | 476 |
2002 - 2018 National Fire Incident Reporting System (NFIRS) incidents
- Incident types reported to NFIRS in Liberty, MO
- 6,73255.0%Rescue & EMS
- 1,77914.5%Hazardous Condition
- 1,30810.7%Fire
- 9297.6%Service Call
- 8937.3%Good Intent Call
- 5464.5%False Alarm
- 410.3%Special Incident
- Fire incident types reported to NFIRS in Liberty, MO
- 50838.8%Outside Fires
- 44834.3%Structure Fires
- 19915.2%Mobile Property/Vehicle Fires
- 15311.7%Other
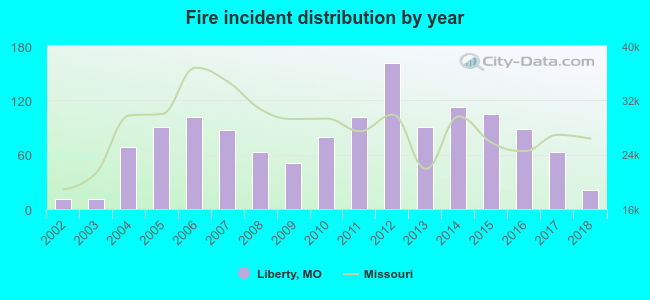 Based on the data from the years 2002 - 2018 the average number of fire incidents per year is 77. The highest number of reported fire incidents - 161 took place in 2012, and the least - 11 in 2002. The data has an increasing trend.
The average number of yearly fire incidents per 10k residents in Liberty, MO compared to nearest cities:
(Note: Based on data for the last 3 years, including only cities with population 5,000 and above)
| Liberty: | 18.9 |
| Gladstone: | 32.8 |
| Kearney: | 65.9 |
| Independence: | 40.0 |
| Excelsior Springs: | 50.8 |
| Smithville: | 27.8 |
| Kansas City: | 38.0 |
| Parkville: | 30.1 |
| Raytown: | 6.4 |
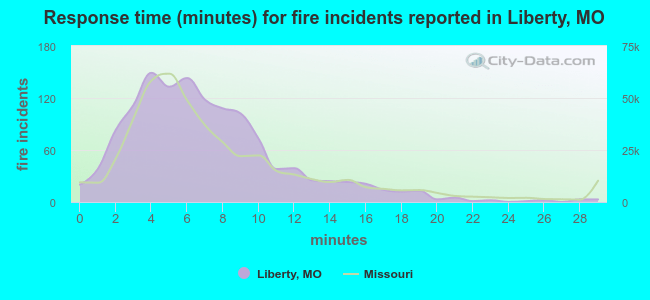 The median response time based on all reported fire incidents is 6 minutes. This is close to the Missouri median value.
The median response time in Liberty, MO compared to nearest cities:
(Note: Based on data for all years, including only cities with at least 500 fire incidents)
| Liberty: | 6 minutes |
| Gladstone: | 4 minutes |
| Kearney: | 7 minutes |
| North Kansas City: | 4 minutes |
| Independence: | 5 minutes |
| Excelsior Springs: | 8 minutes |
| Kansas City: | 5 minutes |
| Parkville: | 6 minutes |
| Holt: | 8 minutes |
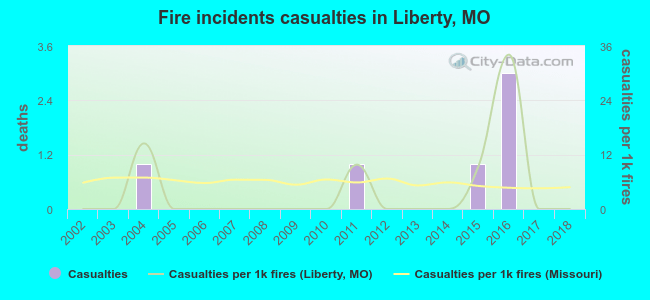 Based on the data from the years 2002 - 2018 the average number of fire-related yearly casualties is 0. The highest number of reported casualties - 3 took place in 2016, and the lowest - 0 in 2002. The data has a constant trend.
The average number of injuries per 1,000 fires is 4. This indicator was the highest - 34 in 2016, and the lowest 0 in 2002. The trend for casualties per 1,000 incidents is constant. Compared to the Missouri value the number of casualties per 1,000 fire incidents is lower.
Based on the data from the years 2002 - 2018 the average number of fire-related yearly casualties is 0. The highest number of reported casualties - 3 took place in 2016, and the lowest - 0 in 2002. The data has a constant trend.
The average number of injuries per 1,000 fires is 4. This indicator was the highest - 34 in 2016, and the lowest 0 in 2002. The trend for casualties per 1,000 incidents is constant. Compared to the Missouri value the number of casualties per 1,000 fire incidents is lower.Casualties per 1,000 incidents in Liberty, MO compared to nearest cities:
(Note: Based on data for all years, including only cities with at least 500 fire incidents)
| Liberty: | 4.6 |
| Gladstone: | 25.9 |
| Kearney: | 2.2 |
| North Kansas City: | 3.8 |
| Independence: | 16.0 |
| Excelsior Springs: | 12.8 |
| Kansas City: | 9.7 |
| Parkville: | 7.7 |
| Holt: | 6.7 |
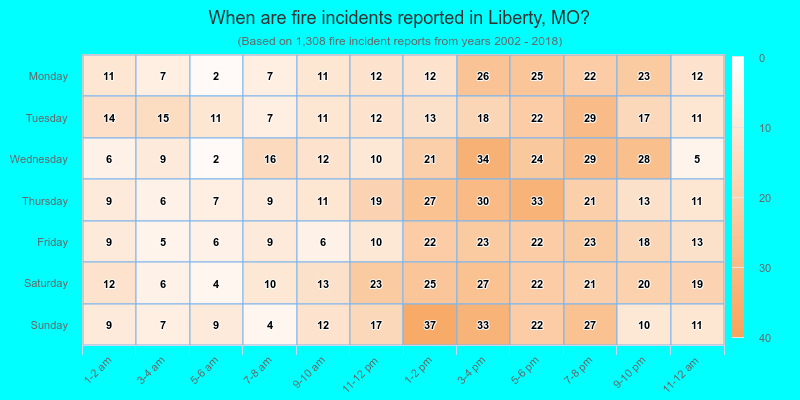
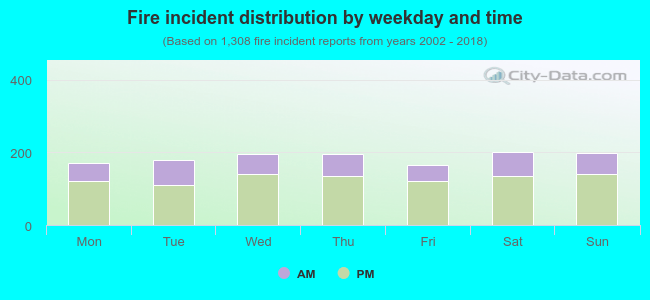 31.1% incidents where reported in the morning and 68.9% in the evening. The most fires (15.4%) took place on Saturday, and the least (12.7%) on Friday.
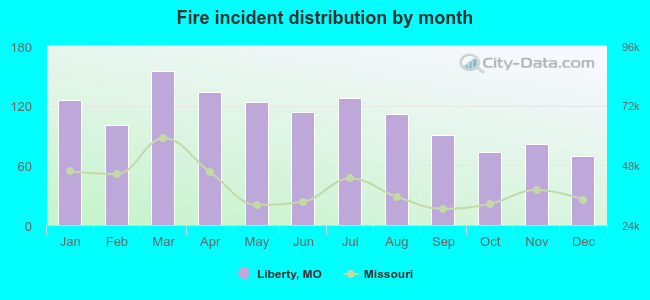 According to the 1,308 incident reports from years 2002 - 2018 most fires (11.9%) took place during March, and the least (5.3%) in December.
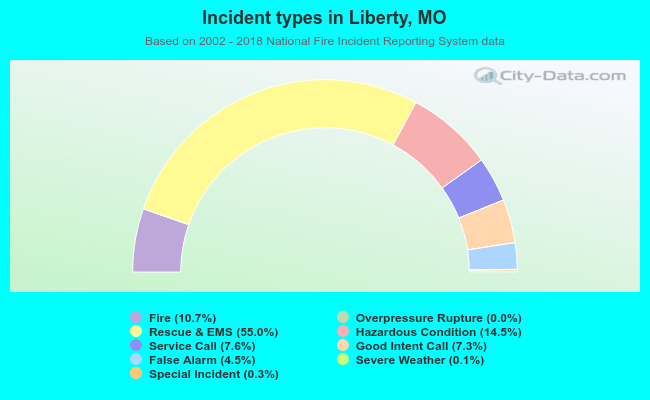 Out of all 12,240 cases reported during the years 2002 - 2018, the most belonged to the categories: Rescue & EMS (55.0%), Hazardous Condition (14.5%), and Fire (10.7%).
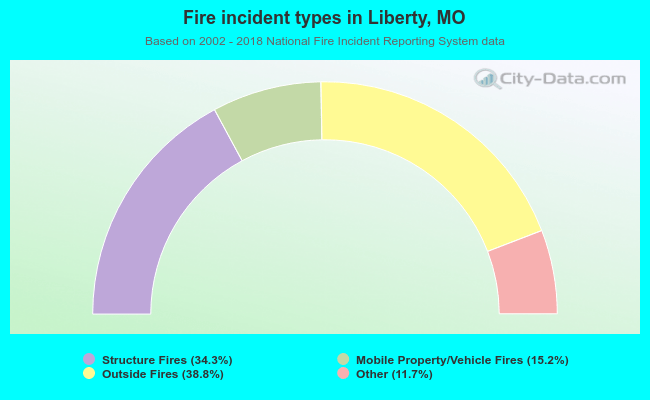 When looking into fire subcategories, the most reports belonged to: Outside Fires (38.8%), and Structure Fires (34.3%).