Kansas City: Fire Incidents, Missouri (MO)
Where are fire incidents reported in Kansas City, MO
Something went wrong! Please refresh the page.
| Fire incidents reported | |
|---|---|
| Sreet name | Count |
| PROSPECT AVE | 596 |
| I 435 HWY | 428 |
| LINWOOD BLVD | 428 |
| PASEO | 416 |
| TRUMAN RD | 412 |
| JACKSON AVE | 408 |
| INDEPENDENCE AVE | 398 |
| TROOST AVE | 374 |
| WABASH AVE | 352 |
| INDIANA AVE | 344 |
| OLIVE ST | 342 |
| BLUE RIDGE BLVD | 338 |
| AGNES AVE | 330 |
| TOPPING AVE | 316 |
| BROOKLYN AVE | 314 |
| HOLMES RD | 306 |
| 12 ST | 302 |
| CLEVELAND AVE | 294 |
| BELLEFONTAINE AVE | 292 |
| MONROE AVE | 292 |
| HIGHLAND AVE | 290 |
| BENTON BLVD | 286 |
| BARRY RD | 280 |
| COLLEGE AVE | 280 |
| BRIGHTON AVE | 276 |
| OAKLEY AVE | 276 |
| MONTGALL AVE | 274 |
| MAIN ST | 272 |
| GARFIELD AVE | 270 |
| HARDESTY AVE | 268 |
| Other | 18,945 |
2004 - 2018 National Fire Incident Reporting System (NFIRS) incidents
- Incident types reported to NFIRS in Kansas City, MO
- 287,28268.3%Rescue & EMS
- 40,1479.5%Service Call
- 30,8327.3%Good Intent Call
- 28,9996.9%Fire
- 26,3446.3%Hazardous Condition
- 6,3111.5%False Alarm
- 6740.2%Special Incident
- Fire incident types reported to NFIRS in Kansas City, MO
- 14,32349.4%Structure Fires
- 7,10924.5%Outside Fires
- 6,60122.8%Mobile Property/Vehicle Fires
- 9663.3%Other
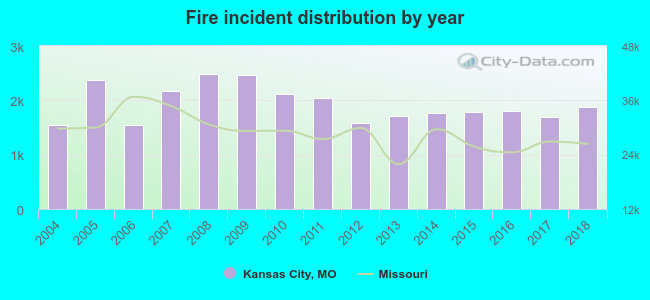 Based on the data from the years 2004 - 2018 the average number of fire incidents per year is 1,930. The highest number of fires - 2,482 took place in 2008, and the least - 1,542 in 2006. The data has a growing trend.
The average number of yearly fire incidents per 10k residents in Kansas City, MO compared to nearest cities:
(Note: Based on data for the last 3 years, including only cities with population 5,000 and above)
| Kansas City: | 38.0 |
| Raytown: | 6.4 |
| Independence: | 40.0 |
| Gladstone: | 32.8 |
| Parkville: | 30.1 |
| Liberty: | 18.9 |
| Grandview: | 44.0 |
| Blue Springs: | 19.5 |
| Belton: | 34.0 |
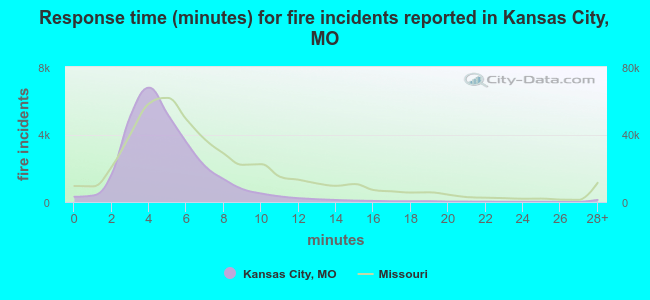 The median response time based on all reported fire incidents is 5 minutes. This is lower than the state median value.
The median response time in Kansas City, MO compared to nearest cities:
(Note: Based on data for all years, including only cities with at least 500 fire incidents)
| Kansas City: | 5 minutes |
| North Kansas City: | 4 minutes |
| Kansas City: | 5 minutes |
| Raytown: | 5 minutes |
| Independence: | 5 minutes |
| Merriam: | 5 minutes |
| Gladstone: | 4 minutes |
| Parkville: | 6 minutes |
| Leawood: | 5 minutes |
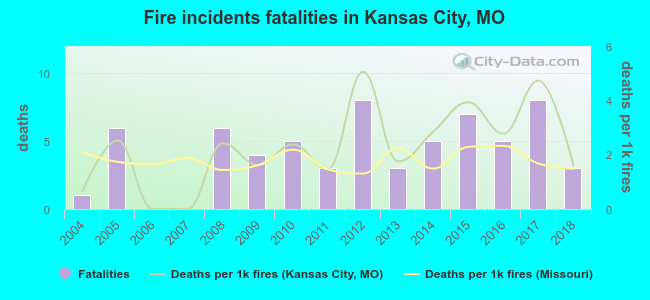 Based on the data from the years 2004 - 2018 the average number of fire-related yearly deaths is 4. The highest number of deaths - 8 took place in 2012, and the lowest - 0 in 2006. The data has a rising trend.
The average number of fatalities per 1,000 fire incidents is 2. This indicator was the highest - 5 in 2012, and the lowest 0 in 2006. The trend for fatalities per 1,000 fires is growing. Compared to the Missouri value the number of fatalities per 1,000 incidents is higher.
Based on the data from the years 2004 - 2018 the average number of fire-related yearly deaths is 4. The highest number of deaths - 8 took place in 2012, and the lowest - 0 in 2006. The data has a rising trend.
The average number of fatalities per 1,000 fire incidents is 2. This indicator was the highest - 5 in 2012, and the lowest 0 in 2006. The trend for fatalities per 1,000 fires is growing. Compared to the Missouri value the number of fatalities per 1,000 incidents is higher.Deaths per 1,000 incidents in Kansas City, MO compared to nearest cities:
(Note: Based on data for all years, including only cities with at least 2,500 fire incidents)
| Kansas City: | 2.2 |
| Kansas City: | 4.0 |
| Independence: | 2.5 |
| Overland Park: | 3.3 |
| Lenexa: | 2.4 |
| Lee's Summit: | 0.8 |
| Blue Springs: | 0.8 |
| Olathe: | 2.9 |
| Leavenworth: | 1.6 |
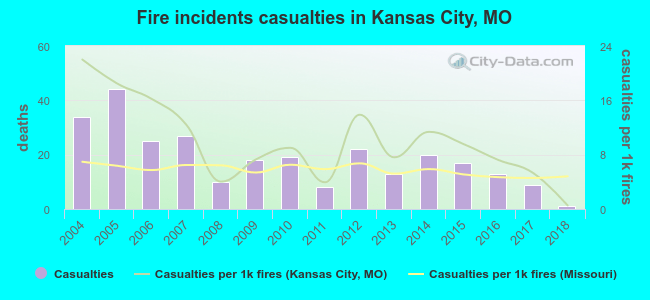 Based on the data from the years 2004 - 2018 the average number of fire-related casualties per year is 19. The highest number of injuries - 44 took place in 2005, and the lowest - 1 in 2018. The data has a declining trend.
The average number of injuries per 1,000 fires is 10. This indicator was the highest - 22 in 2004, and the lowest 1 in 2018. The trend for casualties per 1,000 fires is declining. Compared to the Missouri value the number of casualties per 1,000 incidents is higher.
Based on the data from the years 2004 - 2018 the average number of fire-related casualties per year is 19. The highest number of injuries - 44 took place in 2005, and the lowest - 1 in 2018. The data has a declining trend.
The average number of injuries per 1,000 fires is 10. This indicator was the highest - 22 in 2004, and the lowest 1 in 2018. The trend for casualties per 1,000 fires is declining. Compared to the Missouri value the number of casualties per 1,000 incidents is higher.Casualties per 1,000 incidents in Kansas City, MO compared to nearest cities:
(Note: Based on data for all years, including only cities with at least 500 fire incidents)
| Kansas City: | 9.7 |
| North Kansas City: | 3.8 |
| Kansas City: | 13.3 |
| Raytown: | 1.5 |
| Independence: | 16.0 |
| Merriam: | 9.6 |
| Gladstone: | 25.9 |
| Parkville: | 7.7 |
| Leawood: | 8.3 |
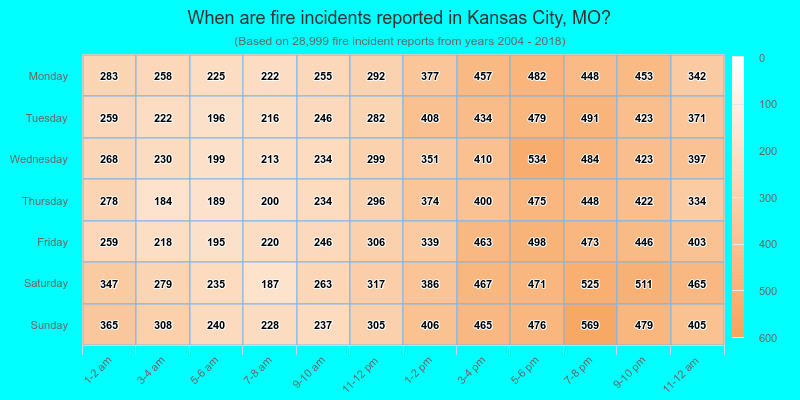
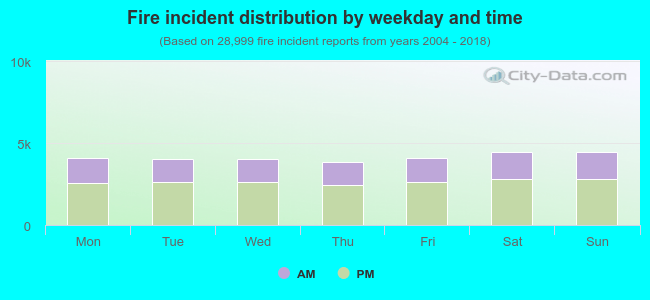 36.3% incidents where reported in the morning and 63.7% in the evening. The most fires (15.5%) took place on Sunday, and the least (13.2%) on Thursday.
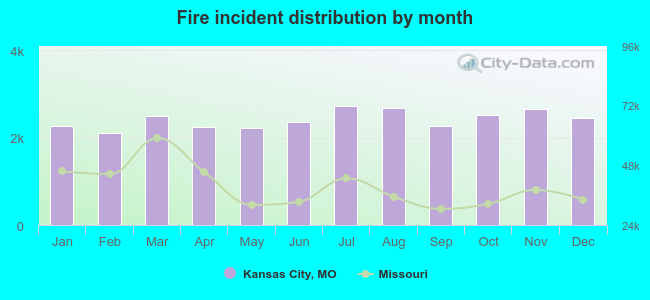 According to the 28,999 reports from years 2004 - 2018 most fires (9.4%) took place during July, and the least (7.3%) in February.
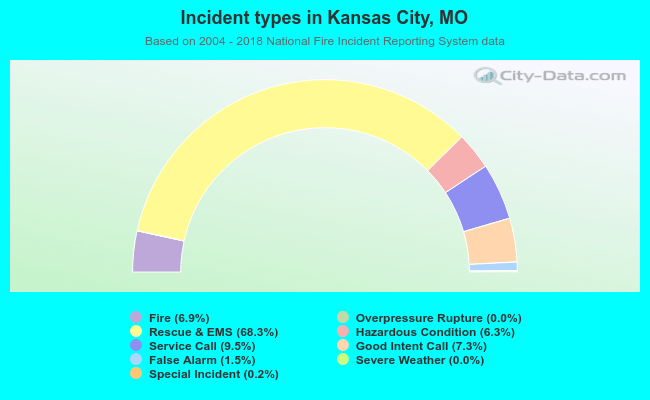 Out of all 420,812 cases reported during the years 2004 - 2018, the most belonged to the categories: Rescue & EMS (68.3%), Service Call (9.5%), and Good Intent Call (7.3%).
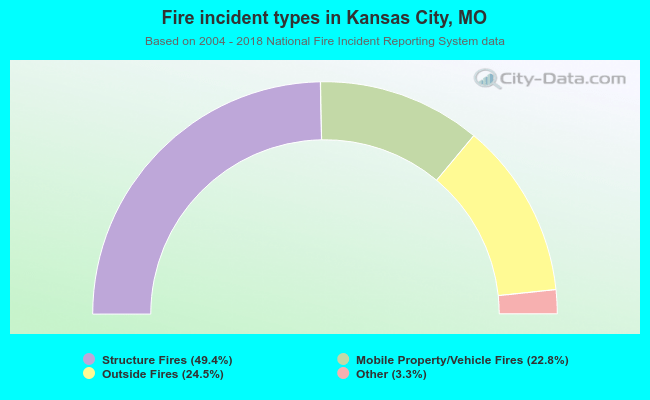 When looking into fire subcategories, the most reports belonged to: Structure Fires (49.4%), and Outside Fires (24.5%).