Smithville: Fire Incidents, Missouri (MO)
Where are fire incidents reported in Smithville, MO
Something went wrong! Please refresh the page.
|
| |||||||||||||||||||||||||||||||||||||||||||||||||||||||||||||||||||||||||||||||||||||||||||||||||||||||||||||
2002 - 2018 National Fire Incident Reporting System (NFIRS) incidents
- Incident types reported to NFIRS in Smithville, MO
- 1,54354.4%Rescue & EMS
- 38013.4%Fire
- 35712.6%Good Intent Call
- 2579.1%Service Call
- 1535.4%Hazardous Condition
- 1344.7%False Alarm
- 60.2%Severe Weather
- 40.1%Special Incident
- Fire incident types reported to NFIRS in Smithville, MO
- 19852.1%Outside Fires
- 12031.6%Structure Fires
- 4712.4%Mobile Property/Vehicle Fires
- 153.9%Other
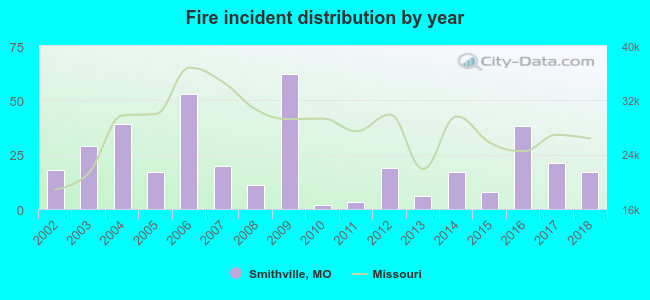 Based on the data from the years 2002 - 2018 the average number of fire incidents per year is 22. The highest number of reported fire incidents - 62 took place in 2009, and the least - 2 in 2010. The data has a decreasing trend.
The average number of yearly fire incidents per 10k residents in Smithville, MO compared to nearest cities:
(Note: Based on data for the last 3 years, including only cities with population 5,000 and above)
| Smithville: | 27.8 |
| Kearney: | 65.9 |
| Gladstone: | 32.8 |
| Liberty: | 18.9 |
| Parkville: | 30.1 |
| Excelsior Springs: | 50.8 |
| Kansas City: | 38.0 |
| Independence: | 40.0 |
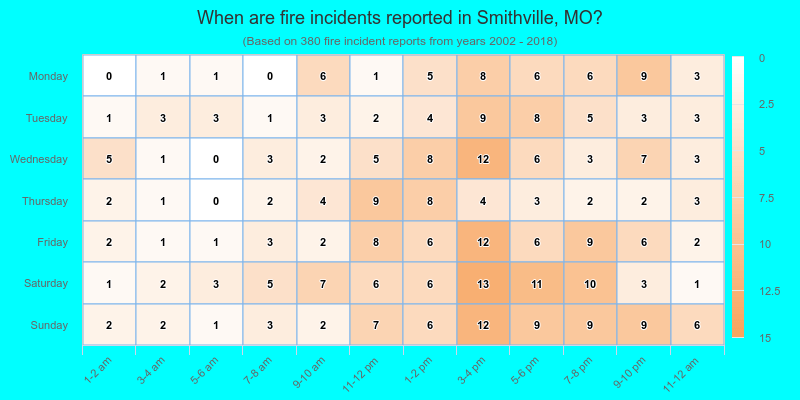
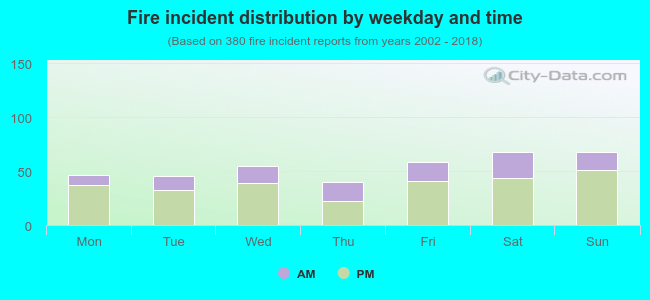 30.0% incidents where reported in the morning and 70.0% in the evening. The most fires (17.9%) took place on Saturday, and the least (10.5%) on Thursday.
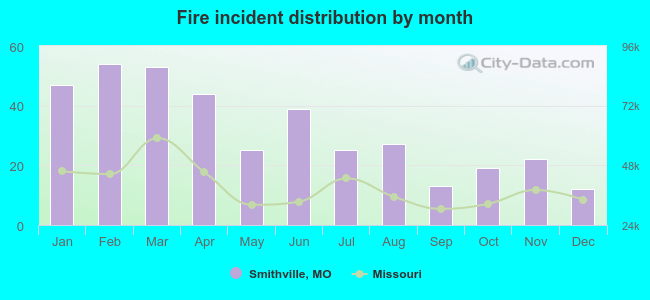 According to the 380 incident reports from years 2002 - 2018 most fires (14.2%) took place during February, and the least (3.2%) in December.
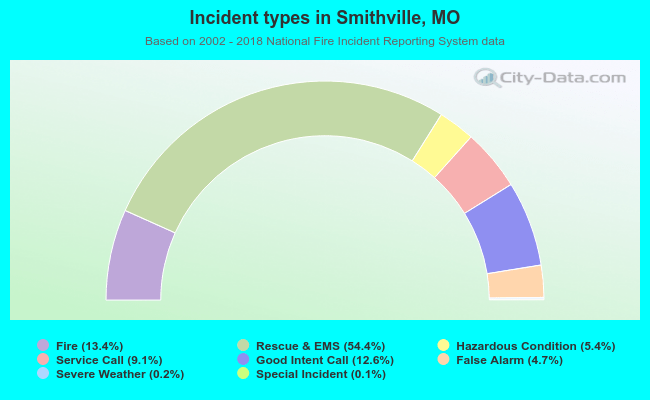 Out of all 2,834 cases reported during the years 2002 - 2018, the most belonged to the categories: Overpressure Rupture (54.4%), Fire (13.4%), and Service Call (12.6%).
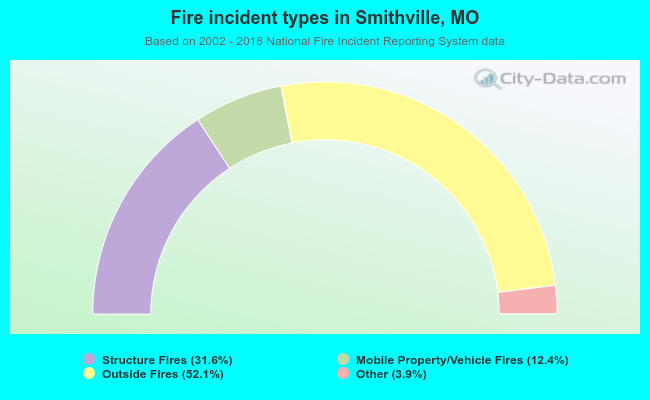 When looking into fire subcategories, the most reports belonged to: Outside Fires (52.1%), and Structure Fires (31.6%).