Lockport: Fire Incidents, New York (NY)
Where are fire incidents reported in Lockport, NY
Something went wrong! Please refresh the page.
| Fire incidents reported | |
|---|---|
| Sreet name | Count |
| DYSINGER RD | 122 |
| RIDGE RD | 94 |
| TRANSIT RD | 92 |
| MAIN ST. | 66 |
| UPPER MT. RD. | 66 |
| ROBINSON RD. EXT. | 56 |
| WALNUT ST. | 50 |
| SOUTH TRANSIT RD | 46 |
| TONAWANDA CREEK RD | 44 |
| WASHBURN ST. | 40 |
| GENESEE ST. | 34 |
| OHIO ST. | 32 |
| SOUTH ST. | 32 |
| DYSINGER RD | 30 |
| PARK AVE. | 30 |
| ROBINSON RD | 30 |
| SAUNDERS SETTLEMENT RD | 30 |
| WEST AVE. | 30 |
| MAIN ST | 28 |
| OHIO ST | 28 |
| ONTARIO ST. | 28 |
| ROBINSON RD | 28 |
| SOUTH TRANSIT RD. | 28 |
| UPPER MOUNTAIN RD | 28 |
| ELMWOOD AVE. | 26 |
| HIGH ST. | 26 |
| LOCKPORT RD | 26 |
| PINE ST. | 26 |
| AKRON RD | 24 |
| EAST AVE. | 24 |
| Other | 968 |
2002 - 2018 National Fire Incident Reporting System (NFIRS) incidents
- Incident types reported to NFIRS in Lockport, NY
- 18,53163.4%Rescue & EMS
- 3,89813.3%Hazardous Condition
- 2,2397.7%False Alarm
- 2,2127.6%Fire
- 1,4134.8%Service Call
- 8102.8%Good Intent Call
- 490.2%Special Incident
- 430.1%Overpressure Rupture
- Fire incident types reported to NFIRS in Lockport, NY
- 1,01045.7%Structure Fires
- 78135.3%Outside Fires
- 29013.1%Mobile Property/Vehicle Fires
- 1315.9%Other
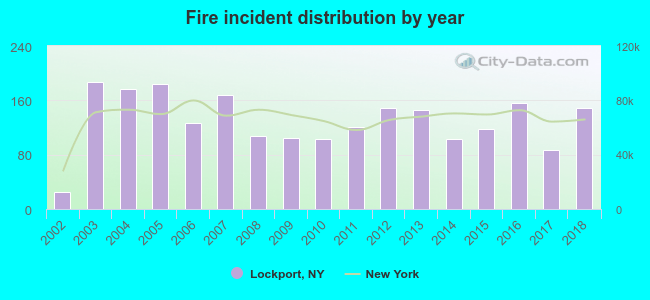 According to the data from the years 2002 - 2018 the average number of fire incidents per year is 130. The highest number of reported fire incidents - 187 took place in 2003, and the least - 25 in 2002. The data has a rising trend.
The average number of yearly fire incidents per 10k residents in Lockport, NY compared to nearest cities:
(Note: Based on data for the last 3 years, including only cities with population 5,000 and above)
| Lockport: | 63.0 |
| Pendleton: | 1.6 |
| Cambria: | 1.7 |
| Royalton: | 2.2 |
| Clarence: | 7.6 |
| North Tonawanda: | 27.1 |
| Amherst: | 14.9 |
| Newstead: | 4.3 |
| Tonawanda: | 81.5 |
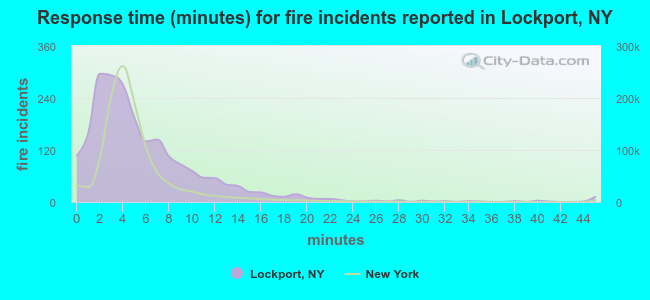 The median response time based on all reported fire incidents is 4 minutes. This is about the same as the New York median value.
The median response time in Lockport, NY compared to nearest cities:
(Note: Based on data for all years, including only cities with at least 500 fire incidents)
| Lockport: | 4 minutes |
| North Tonawanda: | 3 minutes |
| Amherst: | 4 minutes |
| Akron: | 6 minutes |
| Tonawanda: | 2 minutes |
| Williamsville: | 4 minutes |
| Medina: | 5 minutes |
| Kenmore: | 2 minutes |
| Niagara Falls: | 3 minutes |
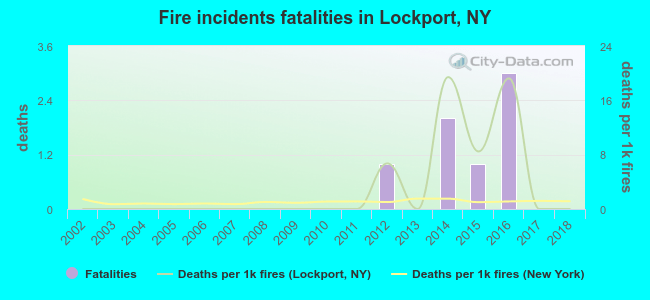 According to the reports from the years 2002 - 2018 the average number of fire-related yearly deaths is 0. The highest number of reported deaths - 3 took place in 2016, and the lowest - 0 in 2002. The data has a constant trend.
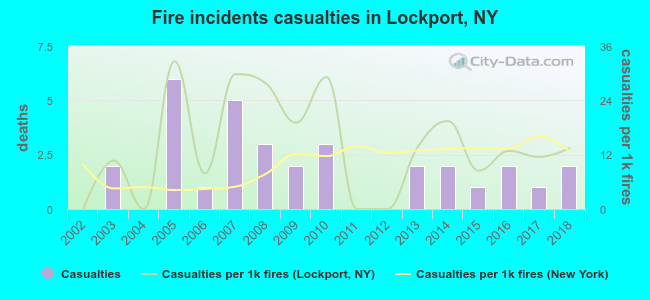 Based on the reports from the years 2002 - 2018 the average number of fire-related yearly casualties is 2. The highest number of reported injuries - 6 took place in 2005, and the lowest - 0 in 2002. The data has a rising trend.
The average number of injuries per 1,000 fires is 14. This indicator was the highest - 33 in 2005, and the lowest 0 in 2002. The trend for casualties per 1,000 fire incidents is growing. Compared to the New York value the number of casualties per 1,000 incidents is higher.
Based on the reports from the years 2002 - 2018 the average number of fire-related yearly casualties is 2. The highest number of reported injuries - 6 took place in 2005, and the lowest - 0 in 2002. The data has a rising trend.
The average number of injuries per 1,000 fires is 14. This indicator was the highest - 33 in 2005, and the lowest 0 in 2002. The trend for casualties per 1,000 fire incidents is growing. Compared to the New York value the number of casualties per 1,000 incidents is higher.Casualties per 1,000 incidents in Lockport, NY compared to nearest cities:
(Note: Based on data for all years, including only cities with at least 500 fire incidents)
| Lockport: | 14.5 |
| North Tonawanda: | 7.9 |
| Amherst: | 6.6 |
| Akron: | 3.5 |
| Tonawanda: | 20.9 |
| Williamsville: | 3.3 |
| Medina: | 3.0 |
| Kenmore: | 35.6 |
| Niagara Falls: | 22.3 |
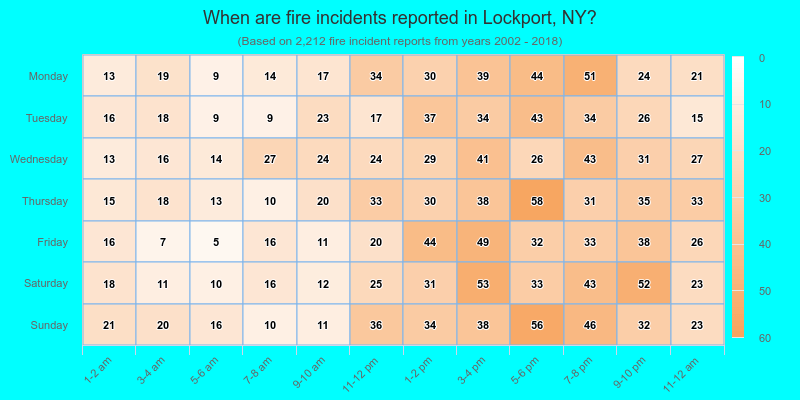
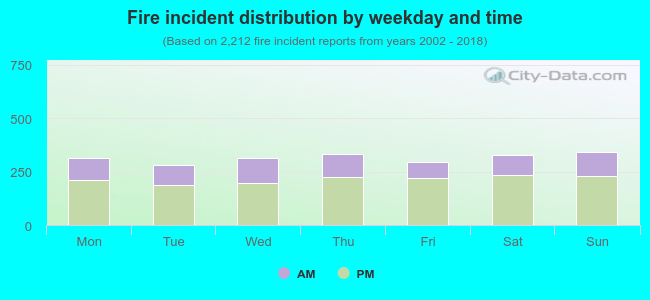 31.9% incidents where reported in the morning and 68.1% in the evening. The most fires (15.5%) took place on Sunday, and the least (12.7%) on Tuesday.
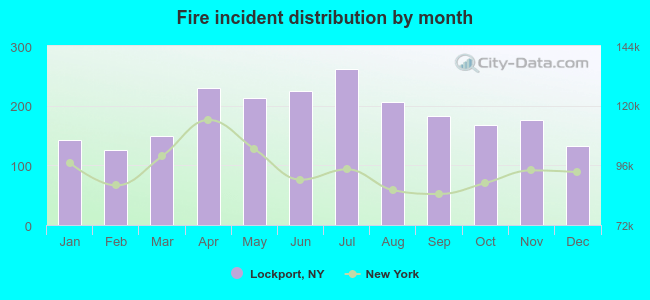 Based on the 2,212 fire incident reports from years 2002 - 2018 most fires (11.8%) took place during July, and the least (5.7%) in February.
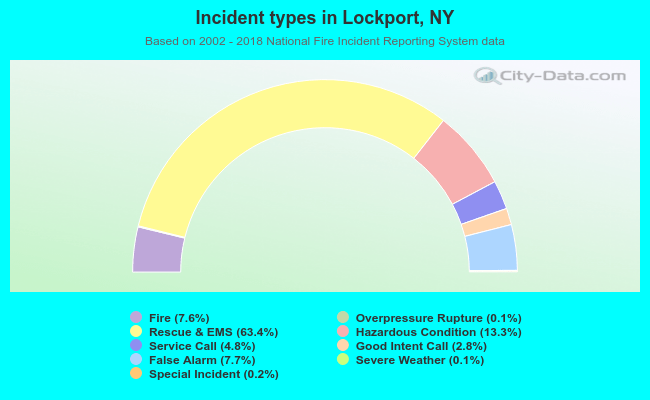 Out of all 29,223 cases reported during the years 2002 - 2018, the most belonged to the categories: Rescue & EMS (63.4%), Hazardous Condition (13.3%), and False Alarm (7.7%).
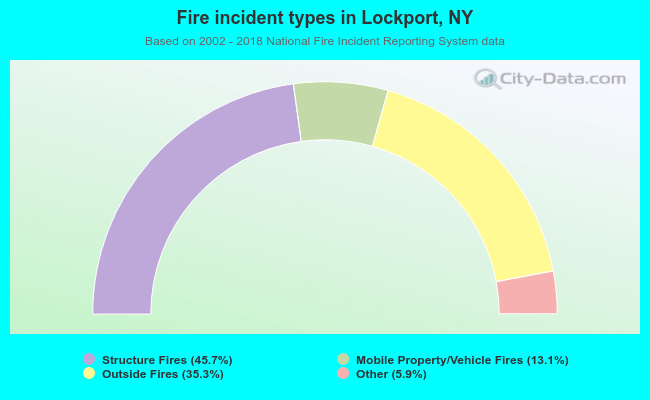 When looking into fire subcategories, the most reports belonged to: Structure Fires (45.7%), and Outside Fires (35.3%).