Niagara Falls: Fire Incidents, New York (NY)
Where are fire incidents reported in Niagara Falls, NY
Something went wrong! Please refresh the page.
| Fire incidents reported | |
|---|---|
| Sreet name | Count |
| CEDAR AVE | 690 |
| NIAGARA FALLS BLVD | 340 |
| BUFFALO AVE | 272 |
| NIAGARA AVE | 240 |
| CEDAR AVE | 208 |
| PINE AVE | 208 |
| PIERCE AVE | 202 |
| MILITARY RD | 190 |
| FERRY AVE | 148 |
| LOCKPORT RD | 138 |
| MAIN ST | 138 |
| 9 ST | 136 |
| ONTARIO AVE | 136 |
| HYDE PARK BLVD | 134 |
| NIAGARA ST | 128 |
| 10 ST | 124 |
| WHITNEY AVE | 124 |
| WILLIAMS RD | 120 |
| LINWOOD AVE | 116 |
| 20 ST | 110 |
| RIVER RD | 110 |
| CLEVELAND AVE | 106 |
| 19 ST | 100 |
| LASALLE AVE | 94 |
| ASHLAND AVE | 92 |
| PACKARD RD | 92 |
| PORTER RD | 92 |
| 17 ST | 86 |
| 3 ST | 86 |
| FALLS ST | 86 |
| Other | 1,474 |
2002 - 2018 National Fire Incident Reporting System (NFIRS) incidents
- Incident types reported to NFIRS in Niagara Falls, NY
- 24,36649.8%Rescue & EMS
- 6,32012.9%Fire
- 5,14410.5%Service Call
- 4,92610.1%Hazardous Condition
- 4,2018.6%False Alarm
- 3,9098.0%Good Intent Call
- Fire incident types reported to NFIRS in Niagara Falls, NY
- 3,53655.9%Structure Fires
- 1,86629.5%Outside Fires
- 73711.7%Mobile Property/Vehicle Fires
- 1812.9%Other
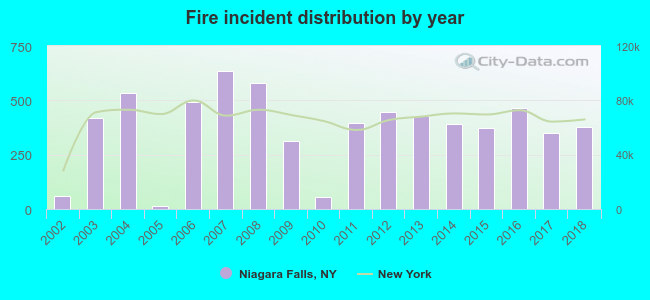 According to the data from the years 2002 - 2018 the average number of fire incidents per year is 372. The highest number of fires - 635 took place in 2007, and the least - 15 in 2005. The data has a rising trend.
The average number of yearly fire incidents per 10k residents in Niagara Falls, NY compared to nearest cities:
(Note: Based on data for the last 3 years, including only cities with population 5,000 and above)
| Niagara Falls: | 80.8 |
| Grand Island: | 26.7 |
| North Tonawanda: | 27.1 |
| Tonawanda: | 81.5 |
| Cambria: | 1.7 |
| Kenmore: | 21.9 |
| Pendleton: | 1.6 |
| Eggertsville: | 1.0 |
| Amherst: | 14.9 |
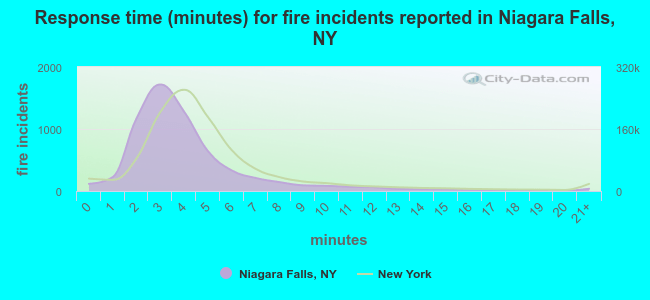 The median response time based on all reported fire incidents is 3 minutes. This is lower than the New York median value.
The median response time in Niagara Falls, NY compared to nearest cities:
(Note: Based on data for all years, including only cities with at least 500 fire incidents)
| Niagara Falls: | 3 minutes |
| Grand Island: | 4 minutes |
| North Tonawanda: | 3 minutes |
| Tonawanda: | 2 minutes |
| Kenmore: | 2 minutes |
| Amherst: | 4 minutes |
| Buffalo: | 3 minutes |
| Williamsville: | 4 minutes |
| Lockport: | 4 minutes |
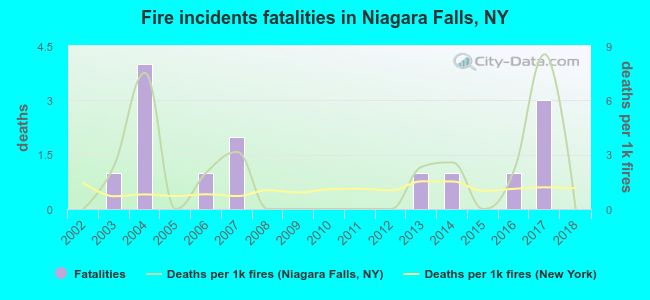 Based on the data from the years 2002 - 2018 the average number of fire-related yearly deaths is 1. The highest number of deaths - 4 took place in 2004, and the lowest - 0 in 2002. The data has a constant trend.
The average number of fatalities per 1,000 fire incidents is 2. This indicator was the highest - 9 in 2017, and the lowest 0 in 2002. The trend for fatalities per 1,000 incidents is constant. Compared to the New York value the number of fatalities per 1,000 fires is much higher.
Based on the data from the years 2002 - 2018 the average number of fire-related yearly deaths is 1. The highest number of deaths - 4 took place in 2004, and the lowest - 0 in 2002. The data has a constant trend.
The average number of fatalities per 1,000 fire incidents is 2. This indicator was the highest - 9 in 2017, and the lowest 0 in 2002. The trend for fatalities per 1,000 incidents is constant. Compared to the New York value the number of fatalities per 1,000 fires is much higher.Deaths per 1,000 incidents in Niagara Falls, NY compared to nearest cities:
(Note: Based on data for all years, including only cities with at least 2,500 fire incidents)
| Niagara Falls: | 2.2 |
| Buffalo: | 1.0 |
| Cheektowaga: | 1.2 |
| West Seneca: | 0.8 |
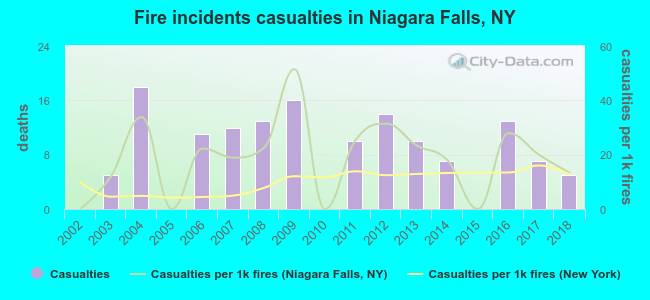 Based on the data from the years 2002 - 2018 the average number of fire-related casualties per year is 8. The highest number of injuries - 18 took place in 2004, and the lowest - 0 in 2002. The data has an increasing trend.
The average number of casualties per 1,000 fires is 19. This indicator was the highest - 51 in 2009, and the lowest 0 in 2002. The trend for casualties per 1,000 fire incidents is increasing. Compared to the state value the number of injuries per 1,000 fire incidents is much higher.
Based on the data from the years 2002 - 2018 the average number of fire-related casualties per year is 8. The highest number of injuries - 18 took place in 2004, and the lowest - 0 in 2002. The data has an increasing trend.
The average number of casualties per 1,000 fires is 19. This indicator was the highest - 51 in 2009, and the lowest 0 in 2002. The trend for casualties per 1,000 fire incidents is increasing. Compared to the state value the number of injuries per 1,000 fire incidents is much higher.Casualties per 1,000 incidents in Niagara Falls, NY compared to nearest cities:
(Note: Based on data for all years, including only cities with at least 500 fire incidents)
| Niagara Falls: | 22.3 |
| Grand Island: | 8.1 |
| North Tonawanda: | 7.9 |
| Tonawanda: | 20.9 |
| Kenmore: | 35.6 |
| Amherst: | 6.6 |
| Buffalo: | 5.5 |
| Williamsville: | 3.3 |
| Lockport: | 14.5 |
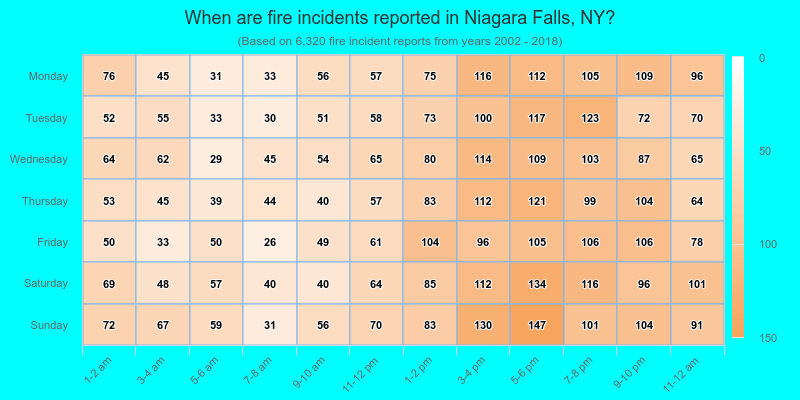
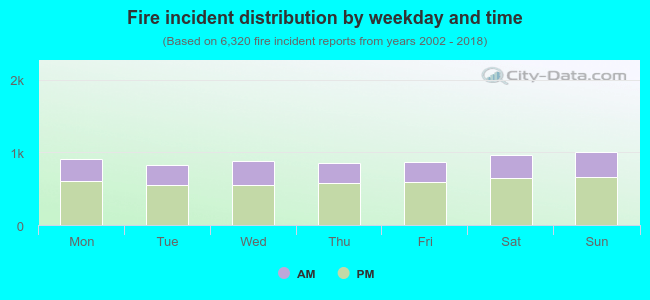 33.5% incidents where reported in the morning and 66.5% in the evening. The most fires (16.0%) took place on Sunday, and the least (13.2%) on Tuesday.
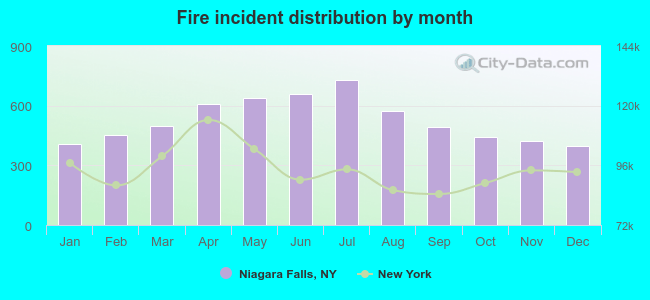 Based on the 6,320 incident reports from years 2002 - 2018 most fires (11.6%) took place during July, and the least (6.3%) in December.
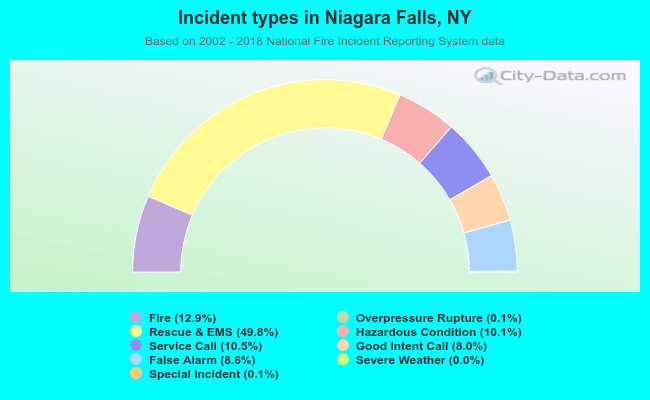 Out of all 48,945 cases reported during the years 2002 - 2018, the most belonged to the categories: Rescue & EMS (49.8%), Fire (12.9%), and Service Call (10.5%).
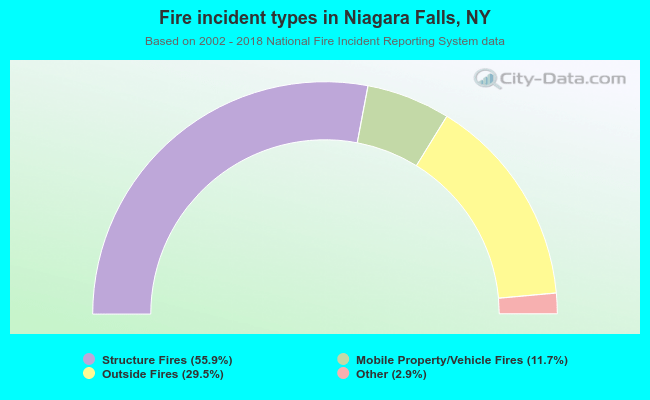 When looking into fire subcategories, the most reports belonged to: Structure Fires (55.9%), and Outside Fires (29.5%).