Long Grove: Fire Incidents, Illinois (IL)
Where are fire incidents reported in Long Grove, IL
Something went wrong! Please refresh the page.
| Fire incidents reported | |
|---|---|
| Sreet name | Count |
| OLD MCHENRY RD | 94 |
| CUBA RD | 56 |
| ROBERT PARKER COFFIN RD | 36 |
| NICHOLS RD | 34 |
| ROUTE 22 | 34 |
| OLD HICKS RD | 32 |
| ROUTE 83 | 32 |
| HIDDEN VALLEY RD | 28 |
| ARLINGTON HEIGHTS RD | 26 |
| TALL OAKS DR | 24 |
| WELLINGTON DR | 24 |
| CHECKER RD | 22 |
| ROUTE 53 | 22 |
| TRENTON CT | 20 |
| GILMER RD | 18 |
| NICHOLS | 18 |
| OLD MC HENRY RD | 18 |
| THREE LAKES DR | 18 |
| APTAKISIC RD | 16 |
| HICKS RD | 16 |
| OLD ROUTE 53 | 16 |
| DIAMOND LAKE RD | 14 |
| MUIRWOOD CT | 14 |
| SADDLE RIDGE CT | 14 |
| MIDDLESAX DR | 12 |
| OUT OF DISTRICT | 12 |
| VICTORIAN DR | 12 |
| CHICKAMAUGA LN | 10 |
| HWY 83 | 10 |
| WILLOW SPRING RD | 10 |
| Other | 35 |
2002 - 2018 National Fire Incident Reporting System (NFIRS) incidents
- Incident types reported to NFIRS in Long Grove, IL
- 3,54242.9%Rescue & EMS
- 1,44517.5%False Alarm
- 91611.1%Service Call
- 89010.8%Good Intent Call
- 7479.0%Fire
- 6998.5%Hazardous Condition
- 190.2%Severe Weather
- Fire incident types reported to NFIRS in Long Grove, IL
- 40353.9%Structure Fires
- 25434.0%Outside Fires
- 638.4%Mobile Property/Vehicle Fires
- 273.6%Other
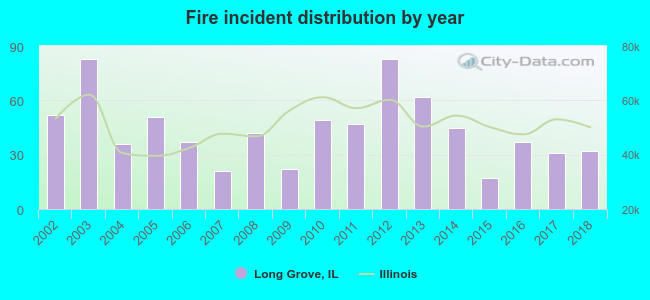 According to the data from the years 2002 - 2018 the average number of fire incidents per year is 44. The highest number of fire incidents - 83 took place in 2003, and the least - 17 in 2015. The data has a dropping trend.
The average number of yearly fire incidents per 10k residents in Long Grove, IL compared to nearest cities:
(Note: Based on data for the last 3 years, including only cities with population 5,000 and above)
| Long Grove: | 40.7 |
| Vernon Hills: | 18.4 |
| Hawthorn Woods: | 20.7 |
| Buffalo Grove: | 20.4 |
| Lake Zurich: | 28.1 |
| Mundelein: | 26.3 |
| Lincolnshire: | 47.1 |
| Libertyville: | 43.1 |
| Palatine: | 20.6 |
 The median response time based on all reported fire incidents is 7 minutes. This is higher than the state median value.
The median response time in Long Grove, IL compared to nearest cities:
(Note: Based on data for all years, including only cities with at least 500 fire incidents)
| Long Grove: | 7 minutes |
| Vernon Hills: | 5 minutes |
| Buffalo Grove: | 5 minutes |
| Lake Zurich: | 8 minutes |
| Mundelein: | 5 minutes |
| Lincolnshire: | 4 minutes |
| Libertyville: | 5 minutes |
| Palatine: | 5 minutes |
| Wheeling: | 5 minutes |
 Based on the reports from the years 2002 - 2018 the average number of fire-related casualties per year is 2. The highest number of reported casualties - 11 took place in 2011, and the lowest - 0 in 2006. The data has a declining trend.
The average number of injuries per 1,000 fire incidents is 39. This indicator was the highest - 234 in 2011, and the lowest 0 in 2006. The trend for injuries per 1,000 incidents is dropping. Compared to the state value the number of casualties per 1,000 incidents is much higher.
Based on the reports from the years 2002 - 2018 the average number of fire-related casualties per year is 2. The highest number of reported casualties - 11 took place in 2011, and the lowest - 0 in 2006. The data has a declining trend.
The average number of injuries per 1,000 fire incidents is 39. This indicator was the highest - 234 in 2011, and the lowest 0 in 2006. The trend for injuries per 1,000 incidents is dropping. Compared to the state value the number of casualties per 1,000 incidents is much higher.Casualties per 1,000 incidents in Long Grove, IL compared to nearest cities:
(Note: Based on data for all years, including only cities with at least 500 fire incidents)
| Long Grove: | 45.5 |
| Vernon Hills: | 25.7 |
| Buffalo Grove: | 19.4 |
| Lake Zurich: | 23.2 |
| Mundelein: | 10.6 |
| Lincolnshire: | 8.4 |
| Libertyville: | 4.3 |
| Palatine: | 16.4 |
| Wheeling: | 57.3 |
 31.3% incidents where reported in the morning and 68.7% in the evening. The most fires (17.0%) took place on Sunday, and the least (10.4%) on Tuesday.
 Based on the 747 fire incidents from years 2002 - 2018 most fires (17.4%) took place during April, and the least (3.9%) in November.
 Out of all 8,265 cases reported during the years 2002 - 2018, the most belonged to the categories: Rescue & EMS (42.9%), False Alarm (17.5%), and Service Call (11.1%).
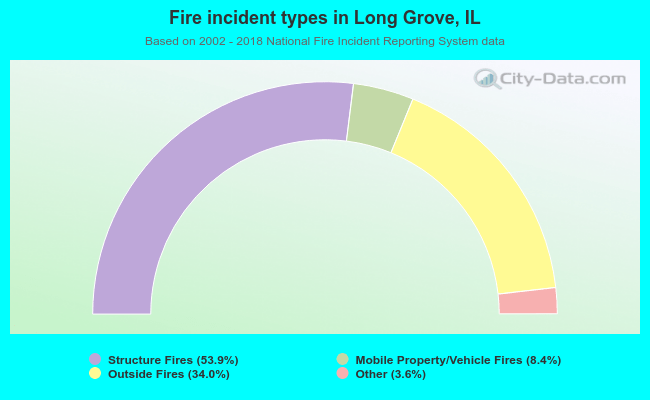 When looking into fire subcategories, the most reports belonged to: Structure Fires (53.9%), and Outside Fires (34.0%).