Mundelein: Fire Incidents, Illinois (IL)
Where are fire incidents reported in Mundelein, IL
Something went wrong! Please refresh the page.
| Fire incidents reported | |
|---|---|
| Sreet name | Count |
| LAKE ST | 182 |
| MIDLOTHIAN RD | 134 |
| GILMER RD | 100 |
| HAWLEY ST | 78 |
| TOWNLINE RD | 76 |
| ROUTE 83 | 64 |
| ROUTE 60 | 62 |
| HICKORY ST | 54 |
| MAPLE AV | 46 |
| DIAMOND LAKE RD | 44 |
| ALLANSON RD | 42 |
| BUTTERFIELD RD | 42 |
| HWY 83 | 40 |
| MIDLOTHIAN | 34 |
| HICKORY AVE | 30 |
| SEYMOUR AV | 30 |
| COURTLAND ST | 28 |
| HUNTINGTON DR | 28 |
| ROUTE 176 | 28 |
| TOWER RD | 28 |
| WALNUT ST | 28 |
| BANBURY RD | 26 |
| HAWLEY | 26 |
| MAPLE AVE | 26 |
| OAK AVE | 26 |
| TERRACE DR | 26 |
| CHURCHILL CT | 24 |
| ROUTE 45 | 24 |
| SHADDLE AV | 24 |
| WIMPOLE ST | 24 |
| Other | 561 |
2002 - 2018 National Fire Incident Reporting System (NFIRS) incidents
- Incident types reported to NFIRS in Mundelein, IL
- 12,77951.2%Rescue & EMS
- 5,32521.3%False Alarm
- 2,1828.7%Hazardous Condition
- 1,9857.9%Fire
- 1,7617.1%Service Call
- 8713.5%Good Intent Call
- 300.1%Overpressure Rupture
- Fire incident types reported to NFIRS in Mundelein, IL
- 1,06453.6%Structure Fires
- 65332.9%Outside Fires
- 20310.2%Mobile Property/Vehicle Fires
- 653.3%Other
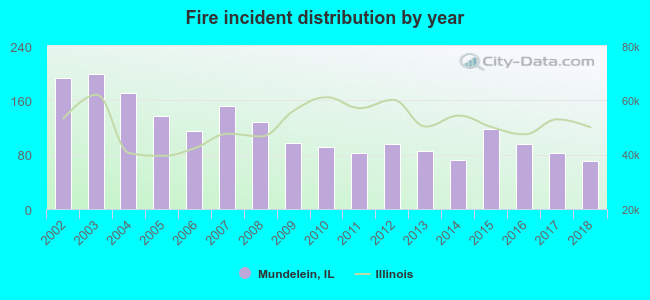 According to the data from the years 2002 - 2018 the average number of fires per year is 117. The highest number of fire incidents - 199 took place in 2003, and the least - 71 in 2018. The data has a decreasing trend.
The average number of yearly fire incidents per 10k residents in Mundelein, IL compared to nearest cities:
(Note: Based on data for the last 3 years, including only cities with population 5,000 and above)
| Mundelein: | 26.3 |
| Libertyville: | 43.1 |
| Vernon Hills: | 18.4 |
| Hawthorn Woods: | 20.7 |
| Long Grove: | 40.7 |
| Grayslake: | 33.6 |
| Gages Lake: | 1.3 |
| Lincolnshire: | 47.1 |
| Lake Zurich: | 28.1 |
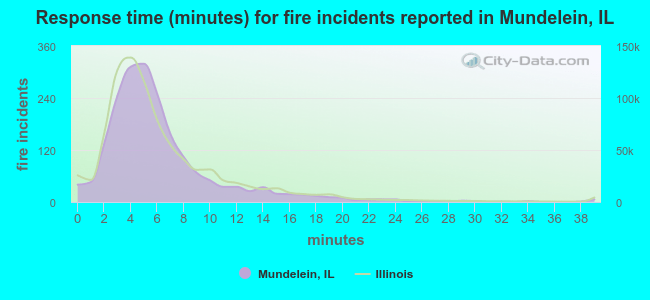 The median response time based on all reported fire incidents is 5 minutes. This is about the same as the Illinois median value.
The median response time in Mundelein, IL compared to nearest cities:
(Note: Based on data for all years, including only cities with at least 500 fire incidents)
| Mundelein: | 5 minutes |
| Libertyville: | 5 minutes |
| Vernon Hills: | 5 minutes |
| Long Grove: | 7 minutes |
| Grayslake: | 6 minutes |
| Lincolnshire: | 4 minutes |
| Lake Zurich: | 8 minutes |
| Wauconda: | 6 minutes |
| Buffalo Grove: | 5 minutes |
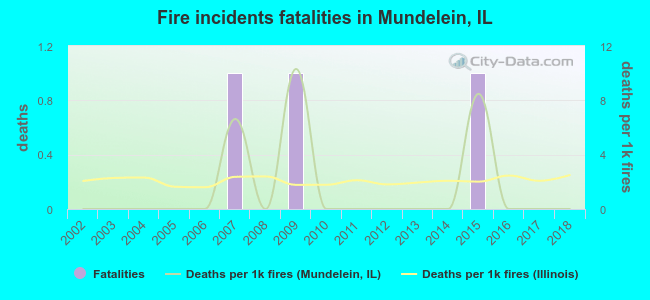 Based on the reports from the years 2002 - 2018 the average number of fire-related yearly deaths is 0. The highest number of deaths - 1 took place in 2007, and the lowest - 0 in 2002. The data has a constant trend.
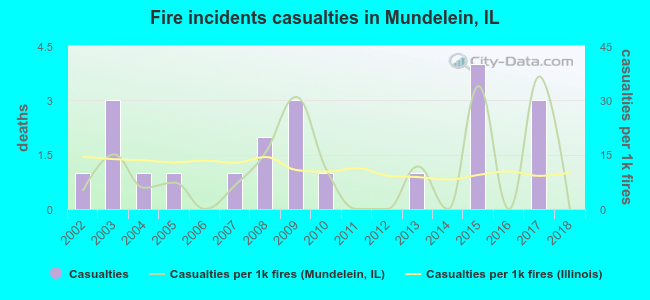 According to the reports from the years 2002 - 2018 the average number of fire-related yearly casualties is 1. The highest number of reported injuries - 4 took place in 2015, and the lowest - 0 in 2006. The data has a dropping trend.
The average number of injuries per 1,000 fire incidents is 11. This indicator was the highest - 37 in 2017, and the lowest 0 in 2006. The trend for casualties per 1,000 fire incidents is declining. Compared to the Illinois value the number of injuries per 1,000 incidents is similar.
According to the reports from the years 2002 - 2018 the average number of fire-related yearly casualties is 1. The highest number of reported injuries - 4 took place in 2015, and the lowest - 0 in 2006. The data has a dropping trend.
The average number of injuries per 1,000 fire incidents is 11. This indicator was the highest - 37 in 2017, and the lowest 0 in 2006. The trend for casualties per 1,000 fire incidents is declining. Compared to the Illinois value the number of injuries per 1,000 incidents is similar.Casualties per 1,000 incidents in Mundelein, IL compared to nearest cities:
(Note: Based on data for all years, including only cities with at least 500 fire incidents)
| Mundelein: | 10.6 |
| Libertyville: | 4.3 |
| Vernon Hills: | 25.7 |
| Long Grove: | 45.5 |
| Grayslake: | 15.9 |
| Lincolnshire: | 8.4 |
| Lake Zurich: | 23.2 |
| Wauconda: | 7.1 |
| Buffalo Grove: | 19.4 |
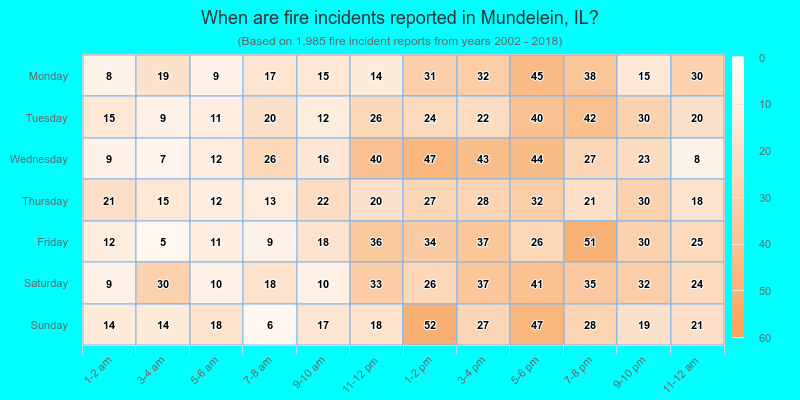
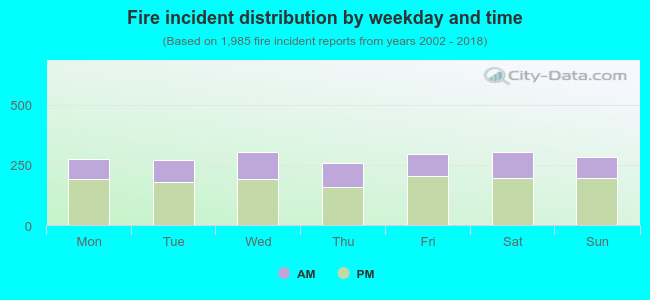 34.1% incidents where reported in the morning and 65.9% in the evening. The most fires (15.4%) took place on Saturday, and the least (13.0%) on Thursday.
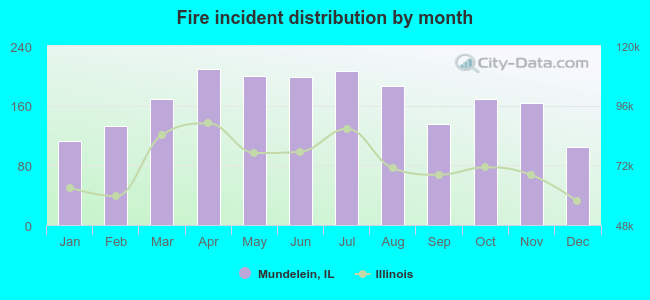 Based on the 1,985 reports from years 2002 - 2018 most fires (10.5%) took place during April, and the least (5.2%) in December.
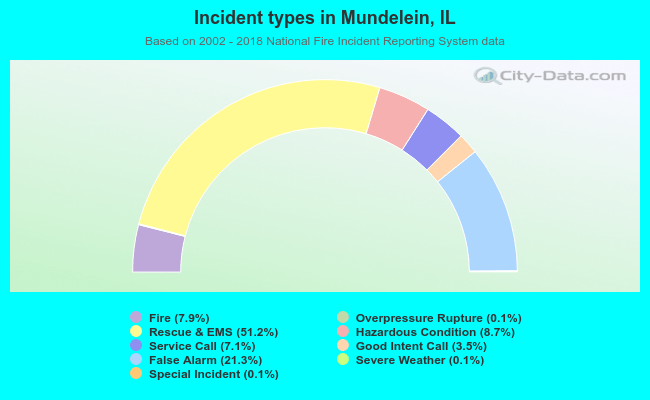 Out of all 24,974 cases reported during the years 2002 - 2018, the most belonged to the categories: Rescue & EMS (51.2%), False Alarm (21.3%), and Hazardous Condition (8.7%).
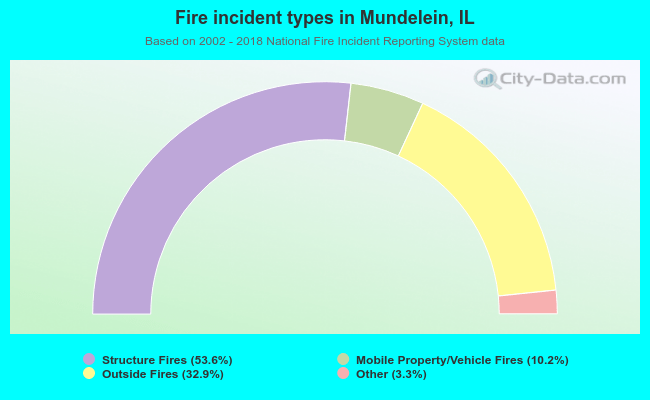 When looking into fire subcategories, the most reports belonged to: Structure Fires (53.6%), and Outside Fires (32.9%).