| Fire incidents reported |
|---|
| Sreet name | Count |
|---|
| HWY 50 | 8 | | HWY 55 HWY | 8 | | RAYSVILLE ROAD | 8 | | TANYARD HILL ROAD | 6 | | BOBO HOLLOW ROAD | 4 | | COBB HOLLOW ROAD | 4 | | DAVENPORT ROAD | 4 | | GOODBRANCH ROAD | 4 | | GRIFFIN ROAD | 4 | | GRIFFIN ROAD RD | 4 | | HIGHWAY 55 | 4 | | HURRICANE CREEK RD | 4 | | HURRICANE CREEK ROAD | 4 | | MECHANIC STRE | 4 | | METRO 41 A | 4 | | MILLSAPS ROAD | 4 | | NEW HERMAN | 4 | | OAK GROVE RD | 4 | | RIDGEVILLE ROAD | 4 | | TANYARD HILL ROAD | 4 | | VALLEY VIEW | 4 | | WABASH RD | 4 | | 1022 CASHION RD | 2 | | 1051 WOOSLEY RD | 2 | | 1366 TANKERSLY RIDGE RD | 2 |
| | | Fire incidents reported |
|---|
| Sreet name | Count |
|---|
| 1476 FLIPPO RD | 2 | | 1541 ED SANDERS RD | 2 | | 160 RIGSBY RIDGE RD | 2 | | 1890 RIDGEVIEW RUN RD | 2 | | 1890 RIDGEVIEW RUN RD. | 2 | | 1919 BULL RUN | 2 | | 1926 FAYETTEVILLE HIGHWAY | 2 | | 205 HURRICANE CREEK RD | 2 | | 2260 GOOD BRANCH RD | 2 | | 230 BELL RD | 2 | | 2467 GOODBRANCH RD | 2 | | 310 CINDY CIRCLE | 2 | | 3264 TANYARD HILL RD | 2 | | 3717 GRIFFITH RD | 2 | | 3947 TANYARD HILL RD | 2 | | 456 TURKEY CREEK CHURCH RD | 2 | | 488 HURRICANE CREEK RD | 2 | | 524 RIDDLE RD | 2 | | 677 BAKERTOWN RD | 2 | | 886 STEWART HOLLOW RD | 2 | | ASHLEY LANE | 2 | | BAGLEY HOLLOW RD | 2 | | BAGLEY HOLLOW ROAD | 2 | | BAGLEY HOLLOW ROAD | 2 | | BAKERTOWN | 2 |
|
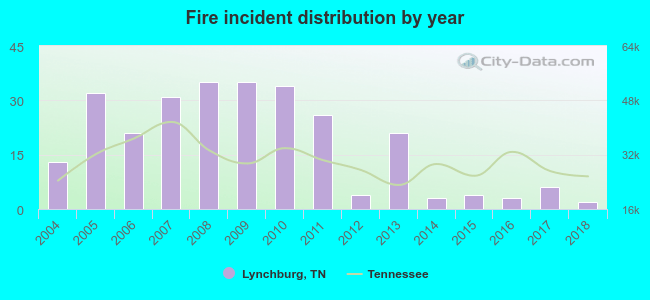 Based on the data from the years 2004 - 2018 the average number of fire incidents per year is 18. The highest number of reported fires - 35 took place in 2008, and the least - 2 in 2018. The data has a declining trend.
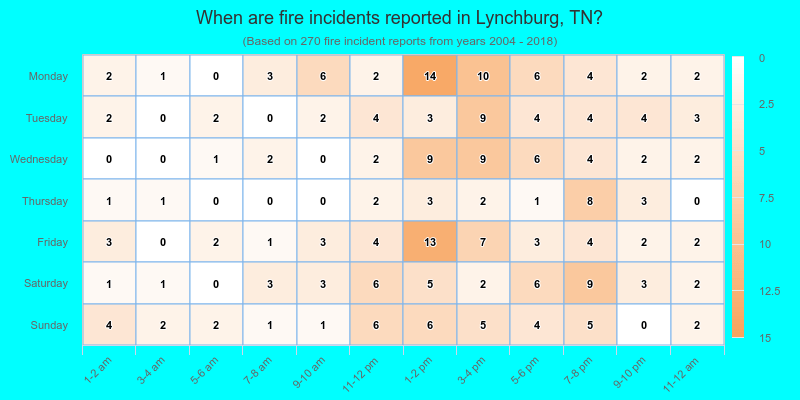
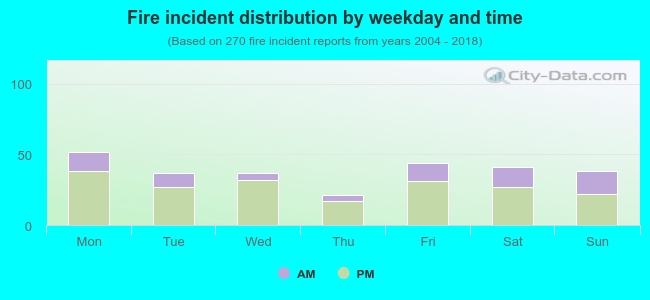 28.1% incidents where reported in the morning and 71.9% in the evening. The most fires (19.3%) took place on Monday, and the least (7.8%) on Thursday.
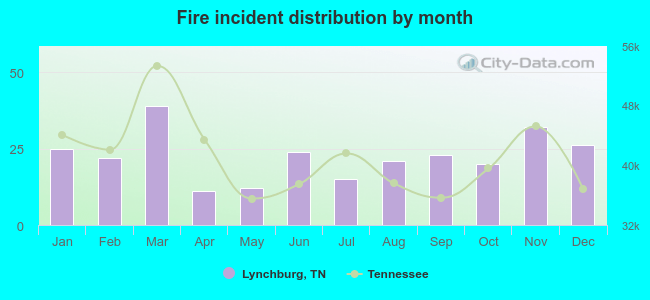 According to the 270 fires from years 2004 - 2018 most fires (14.4%) took place during March, and the least (4.1%) in April.
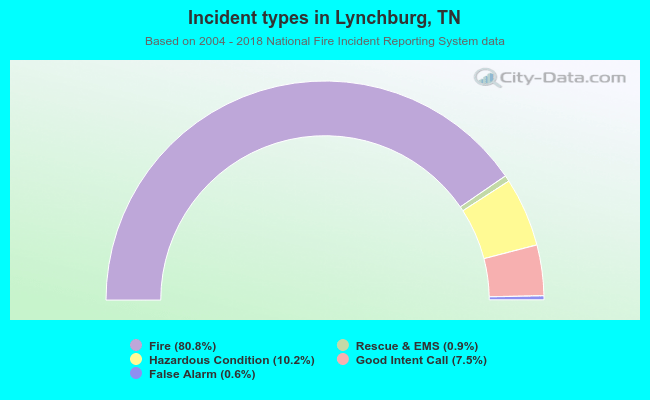 Out of all 334 cases reported during the years 2004 - 2018, the most belonged to the categories: Fire (80.8%), Rescue & EMS (10.2%), and Hazardous Condition (7.5%).
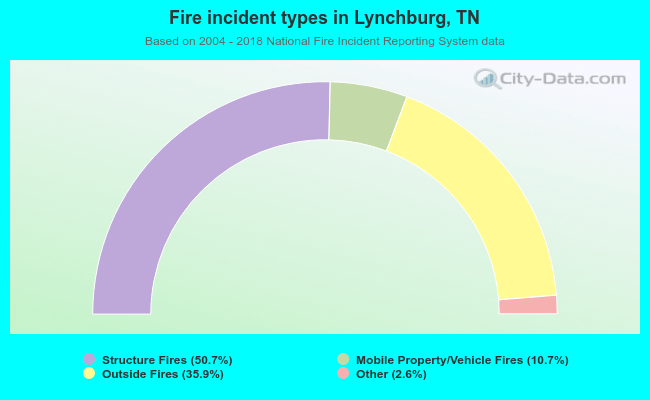 When looking into fire subcategories, the most incidents belonged to: Structure Fires (50.7%), and Outside Fires (35.9%).