Tullahoma: Fire Incidents, Tennessee (TN)
Where are fire incidents reported in Tullahoma, TN
Something went wrong! Please refresh the page.
| Fire incidents reported | |
|---|---|
| Sreet name | Count |
| OLD MANCHESTER HWY | 48 |
| GRIZZARD ST | 40 |
| JACKSON ST | 34 |
| JACKSON ST | 28 |
| LINCOLN ST | 26 |
| LINCOLN ST | 20 |
| MOORE ST | 20 |
| SILVER ST | 16 |
| WASHINGTON ST | 16 |
| CEDAR LN | 14 |
| GRIZZARD ST | 14 |
| GRUNDY ST | 14 |
| ATLANTIC ST | 12 |
| FRANKLIN ST | 12 |
| MOORE ST | 12 |
| N. JACKSON ST. | 12 |
| NORTH JACKSON ST. | 12 |
| TULLAHOMA HWY | 12 |
| ANDERSON ST | 10 |
| COUNTRY CLUB DR | 10 |
| EAST LINCOLN ST. | 10 |
| GRUNDY ST | 10 |
| HELEN ST. | 10 |
| MONROE ST | 10 |
| N JACKSON ST | 10 |
| OVOCA RD. | 10 |
| WASHINGTON ST | 10 |
| ANDERSON ST | 8 |
| AWALT RD | 8 |
| BLUE CREEK RD | 8 |
| Other | 1,007 |
2003 - 2018 National Fire Incident Reporting System (NFIRS) incidents
- Incident types reported to NFIRS in Tullahoma, TN
- 3,47543.6%Rescue & EMS
- 1,58519.9%Service Call
- 1,48318.6%Fire
- 6658.3%False Alarm
- 4816.0%Hazardous Condition
- 2713.4%Good Intent Call
- 90.1%Special Incident
- Fire incident types reported to NFIRS in Tullahoma, TN
- 57638.8%Outside Fires
- 54136.5%Structure Fires
- 27118.3%Mobile Property/Vehicle Fires
- 956.4%Other
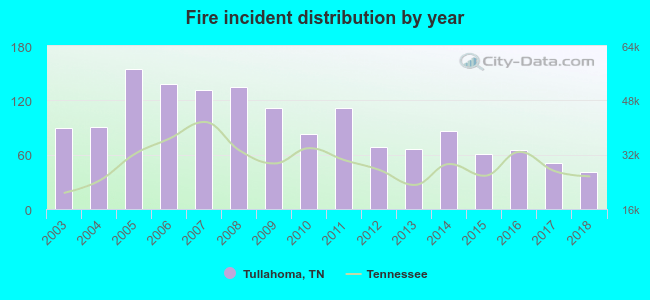 Based on the data from the years 2003 - 2018 the average number of fires per year is 93. The highest number of fire incidents - 155 took place in 2005, and the least - 41 in 2018. The data has a dropping trend.
The average number of yearly fire incidents per 10k residents in Tullahoma, TN compared to nearest cities:
(Note: Based on data for the last 3 years, including only cities with population 5,000 and above)
| Tullahoma: | 27.7 |
| Lynchburg: | 5.8 |
| Manchester: | 185.5 |
| Winchester: | 110.8 |
| Shelbyville: | 70.4 |
| Christiana: | 52.6 |
| Fayetteville: | 83.1 |
| Unionville: | 30.1 |
| McMinnville: | 87.6 |
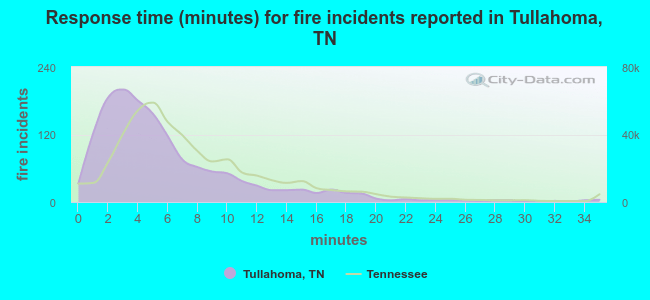 The median response time based on all reported fire incidents is 5 minutes. This is lower than the state median value.
The median response time in Tullahoma, TN compared to nearest cities:
(Note: Based on data for all years, including only cities with at least 500 fire incidents)
| Tullahoma: | 5 minutes |
| Estill Springs: | 9 minutes |
| Manchester: | 9 minutes |
| Decherd: | 6 minutes |
| Hillsboro: | 15 minutes |
| Winchester: | 6 minutes |
| Shelbyville: | 6 minutes |
| Christiana: | 11 minutes |
| Fayetteville: | 5 minutes |
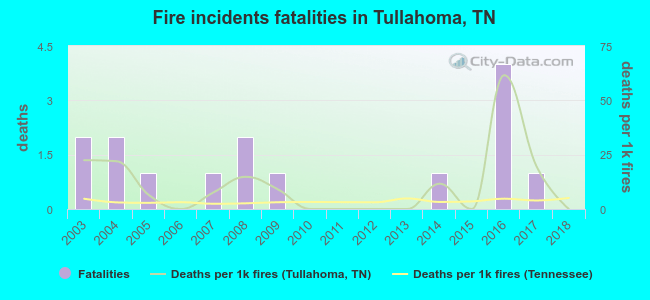 According to the reports from the years 2003 - 2018 the average number of fire-related fatalities per year is 1. The highest number of deaths - 4 took place in 2016, and the lowest - 0 in 2006. The data has a decreasing trend.
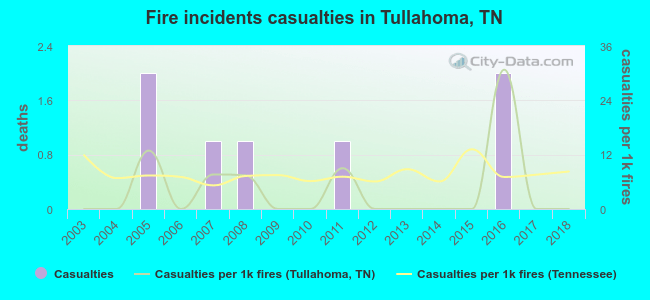 Based on the data from the years 2003 - 2018 the average number of fire-related yearly casualties is 0. The highest number of casualties - 2 took place in 2005, and the lowest - 0 in 2003. The data has a constant trend.
The average number of injuries per 1,000 fire incidents is 4. This indicator was the highest - 31 in 2016, and the lowest 0 in 2003. The trend for casualties per 1,000 fire incidents is constant. Compared to the Tennessee value the number of injuries per 1,000 fire incidents is lower.
Based on the data from the years 2003 - 2018 the average number of fire-related yearly casualties is 0. The highest number of casualties - 2 took place in 2005, and the lowest - 0 in 2003. The data has a constant trend.
The average number of injuries per 1,000 fire incidents is 4. This indicator was the highest - 31 in 2016, and the lowest 0 in 2003. The trend for casualties per 1,000 fire incidents is constant. Compared to the Tennessee value the number of injuries per 1,000 fire incidents is lower.Casualties per 1,000 incidents in Tullahoma, TN compared to nearest cities:
(Note: Based on data for all years, including only cities with at least 500 fire incidents)
| Tullahoma: | 4.7 |
| Estill Springs: | 4.8 |
| Manchester: | 1.6 |
| Decherd: | 6.2 |
| Hillsboro: | 0.0 |
| Winchester: | 4.6 |
| Shelbyville: | 7.1 |
| Christiana: | 0.0 |
| Fayetteville: | 2.0 |
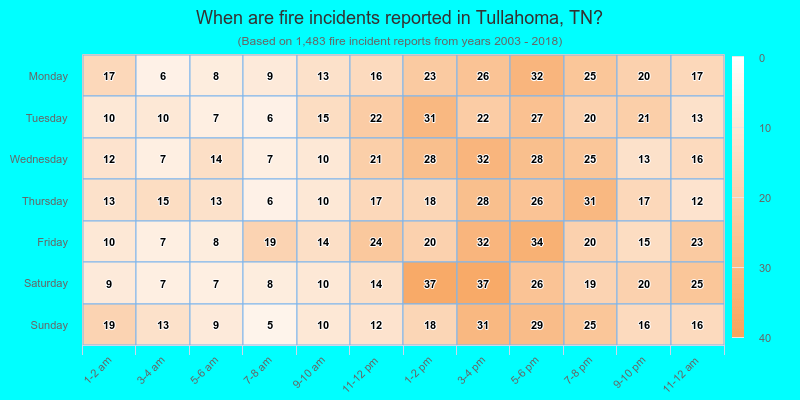
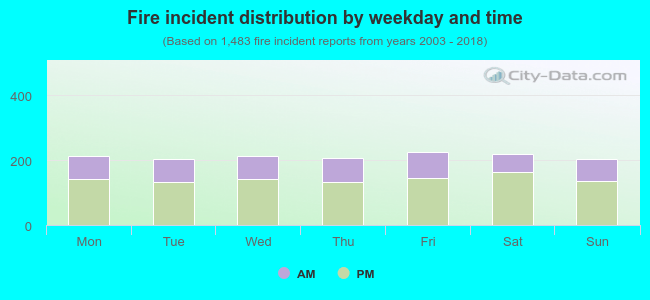 33.0% incidents where reported in the morning and 67.0% in the evening. The most fires (15.2%) took place on Friday, and the least (13.7%) on Sunday.
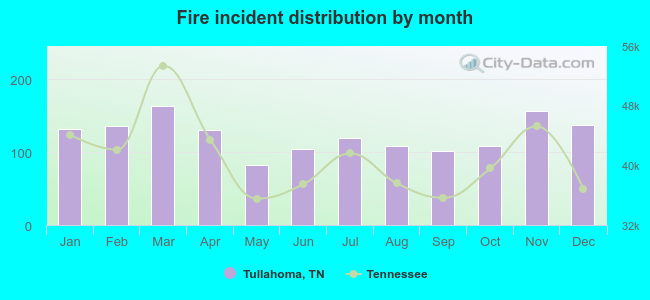 According to the 1,483 fire incident reports from years 2003 - 2018 most fires (11.1%) took place during March, and the least (5.5%) in May.
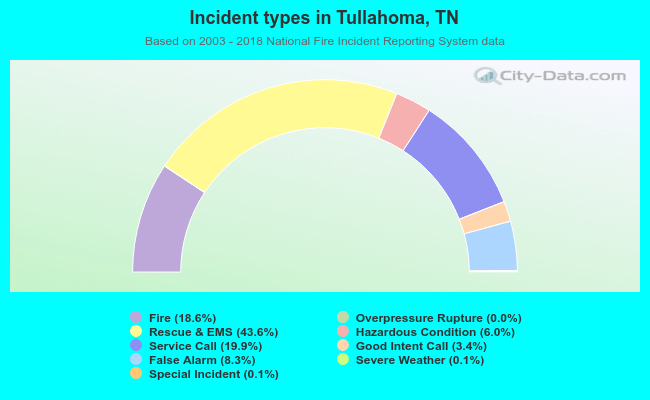 Out of all 7,977 cases reported during the years 2003 - 2018, the most belonged to the categories: Rescue & EMS (43.6%), Service Call (19.9%), and Fire (18.6%).
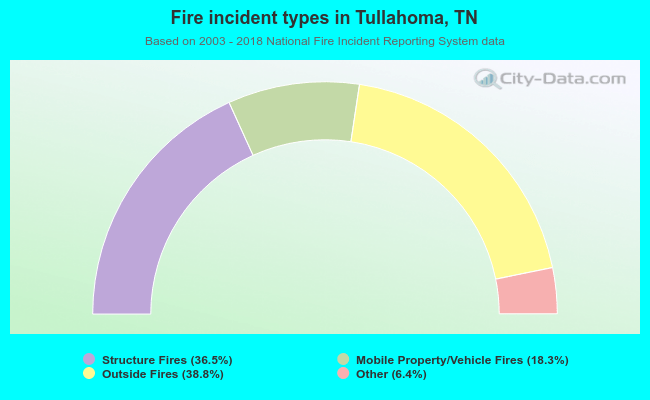 When looking into fire subcategories, the most incidents belonged to: Outside Fires (38.8%), and Structure Fires (36.5%).