Shelbyville: Fire Incidents, Tennessee (TN)
Where are fire incidents reported in Shelbyville, TN
Something went wrong! Please refresh the page.
| Fire incidents reported | |
|---|---|
| Sreet name | Count |
| MAIN ST | 170 |
| MADISON ST | 162 |
| CANNON BLVD | 102 |
| MIDLAND RD | 78 |
| HWY. 64 | 72 |
| LANE ST | 72 |
| DEPOT ST | 68 |
| UNION ST | 66 |
| EAGLE BLVD | 58 |
| SIMS RD | 58 |
| BARKSDALE LN | 56 |
| FAIRFIELD PIKE | 56 |
| FRANK MARTIN RD | 50 |
| HALLS MILL RD | 50 |
| WARNER BRIDGE RD | 48 |
| WHITAKER RD | 48 |
| HWY 231 | 46 |
| EL BETHEL RD | 38 |
| HWY 41 A | 38 |
| HWY. 41 A N. | 38 |
| HWY. 82 | 38 |
| PICKLE RD | 38 |
| 231 HWY | 36 |
| MORTON ST | 36 |
| WARTRACE PIKE | 36 |
| ANTHONY LN | 34 |
| HWY 64 | 34 |
| HWY. 41 A N. | 34 |
| LANDERS ST | 34 |
| BELMONT AVE | 32 |
| Other | 1,214 |
2002 - 2018 National Fire Incident Reporting System (NFIRS) incidents
- Incident types reported to NFIRS in Shelbyville, TN
- 8,02659.5%Rescue & EMS
- 2,94021.8%Fire
- 8246.1%False Alarm
- 7345.4%Good Intent Call
- 5283.9%Hazardous Condition
- 4013.0%Service Call
- 150.1%Severe Weather
- Fire incident types reported to NFIRS in Shelbyville, TN
- 1,18140.2%Outside Fires
- 1,00234.1%Structure Fires
- 63221.5%Mobile Property/Vehicle Fires
- 1254.3%Other
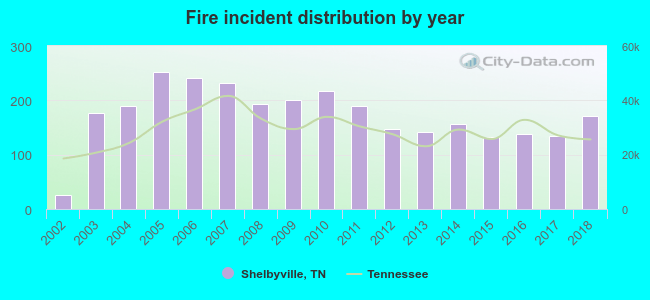 According to the data from the years 2002 - 2018 the average number of fires per year is 173. The highest number of reported fires - 252 took place in 2005, and the least - 26 in 2002. The data has a rising trend.
The average number of yearly fire incidents per 10k residents in Shelbyville, TN compared to nearest cities:
(Note: Based on data for the last 3 years, including only cities with population 5,000 and above)
| Shelbyville: | 70.4 |
| Unionville: | 30.1 |
| Christiana: | 52.6 |
| Lynchburg: | 5.8 |
| Tullahoma: | 27.7 |
| Lewisburg: | 88.2 |
| Manchester: | 185.5 |
| Fayetteville: | 83.1 |
| Murfreesboro: | 42.6 |
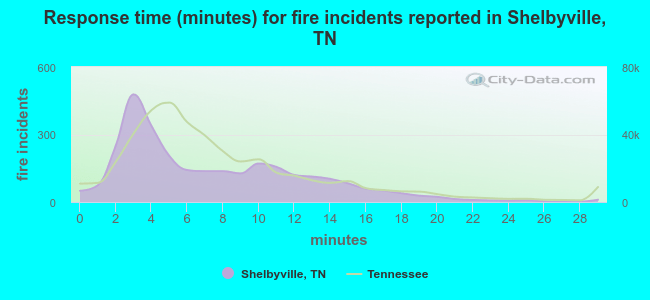 The median response time based on all reported fire incidents is 6 minutes. This is comparable to the Tennessee median value.
The median response time in Shelbyville, TN compared to nearest cities:
(Note: Based on data for all years, including only cities with at least 500 fire incidents)
| Shelbyville: | 6 minutes |
| Christiana: | 11 minutes |
| Tullahoma: | 5 minutes |
| Chapel Hill: | 8 minutes |
| Lewisburg: | 6 minutes |
| Manchester: | 9 minutes |
| Estill Springs: | 9 minutes |
| Fayetteville: | 5 minutes |
| Murfreesboro: | 6 minutes |
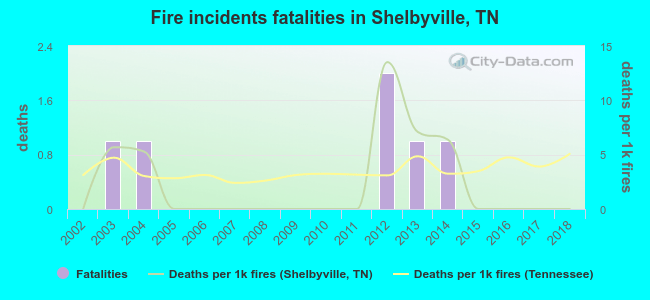 According to the reports from the years 2002 - 2018 the average number of fire-related yearly deaths is 0. The highest number of deaths - 2 took place in 2012, and the lowest - 0 in 2002. The data has a constant trend.
The average number of fatalities per 1,000 fire incidents is 2. This indicator was the highest - 14 in 2012, and the lowest 0 in 2002. The trend for deaths per 1,000 fires is constant. Compared to the Tennessee value the number of fatalities per 1,000 fires is lower.
According to the reports from the years 2002 - 2018 the average number of fire-related yearly deaths is 0. The highest number of deaths - 2 took place in 2012, and the lowest - 0 in 2002. The data has a constant trend.
The average number of fatalities per 1,000 fire incidents is 2. This indicator was the highest - 14 in 2012, and the lowest 0 in 2002. The trend for deaths per 1,000 fires is constant. Compared to the Tennessee value the number of fatalities per 1,000 fires is lower.Deaths per 1,000 incidents in Shelbyville, TN compared to nearest cities:
(Note: Based on data for all years, including only cities with at least 2,500 fire incidents)
| Shelbyville: | 2.0 |
| Manchester: | 2.4 |
| Murfreesboro: | 3.8 |
| Columbia: | 3.1 |
| Franklin: | 2.5 |
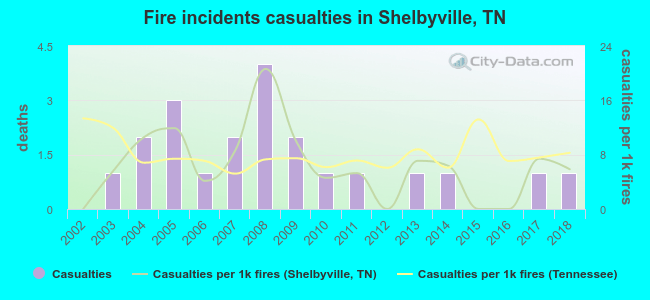 According to the data from the years 2002 - 2018 the average number of fire-related casualties per year is 1. The highest number of reported casualties - 4 took place in 2008, and the lowest - 0 in 2002. The data has an increasing trend.
The average number of casualties per 1,000 fire incidents is 6. This indicator was the highest - 21 in 2008, and the lowest 0 in 2002. The trend for injuries per 1,000 fire incidents is increasing. Compared to the state value the number of injuries per 1,000 incidents is similar.
According to the data from the years 2002 - 2018 the average number of fire-related casualties per year is 1. The highest number of reported casualties - 4 took place in 2008, and the lowest - 0 in 2002. The data has an increasing trend.
The average number of casualties per 1,000 fire incidents is 6. This indicator was the highest - 21 in 2008, and the lowest 0 in 2002. The trend for injuries per 1,000 fire incidents is increasing. Compared to the state value the number of injuries per 1,000 incidents is similar.Casualties per 1,000 incidents in Shelbyville, TN compared to nearest cities:
(Note: Based on data for all years, including only cities with at least 500 fire incidents)
| Shelbyville: | 7.1 |
| Christiana: | 0.0 |
| Tullahoma: | 4.7 |
| Chapel Hill: | 1.8 |
| Lewisburg: | 2.4 |
| Manchester: | 1.6 |
| Estill Springs: | 4.8 |
| Fayetteville: | 2.0 |
| Murfreesboro: | 12.2 |
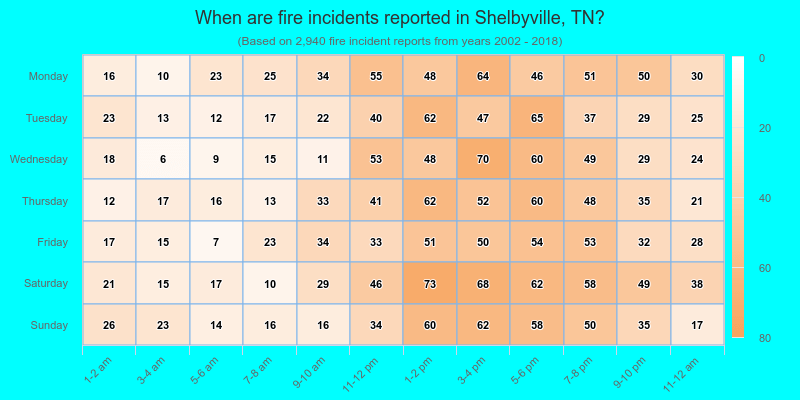
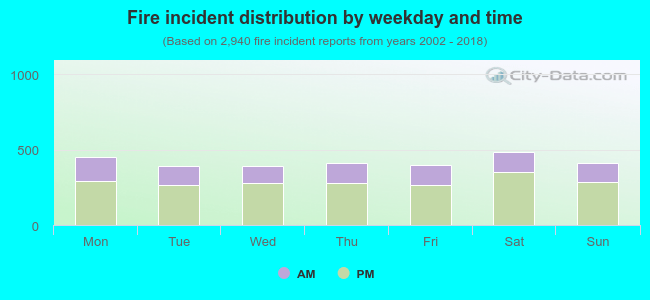 31.6% incidents where reported in the morning and 68.4% in the evening. The most fires (16.5%) took place on Saturday, and the least (13.3%) on Tuesday.
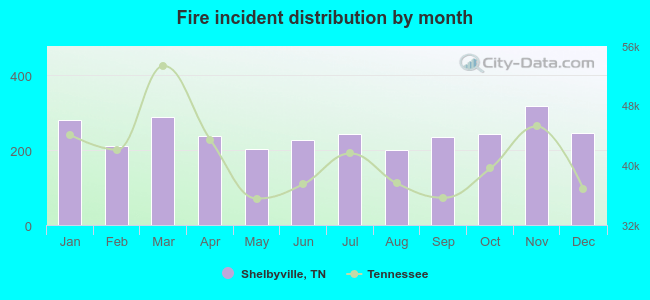 According to the 2,940 fire incidents from years 2002 - 2018 most fires (10.9%) took place during November, and the least (6.8%) in August.
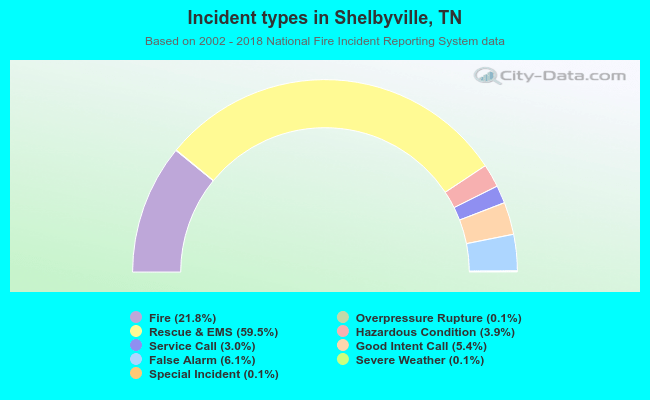 Out of all 13,488 cases reported during the years 2002 - 2018, the most belonged to the categories: Rescue & EMS (59.5%), Fire (21.8%), and False Alarm (6.1%).
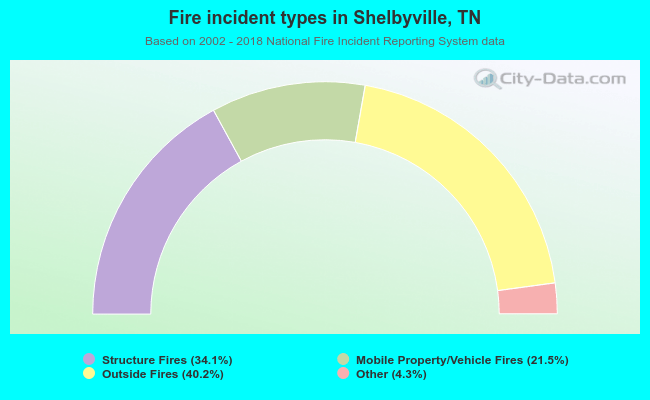 When looking into fire subcategories, the most reports belonged to: Outside Fires (40.2%), and Structure Fires (34.1%).