Lynden: Fire Incidents, Washington (WA)
Where are fire incidents reported in Lynden, WA
Something went wrong! Please refresh the page.
|
| |||||||||||||||||||||||||||||||||||||||||||||||||||||||||||||||||||||||||||||||||||||||||||||||||||||||||||||
2002 - 2018 National Fire Incident Reporting System (NFIRS) incidents
- Incident types reported to NFIRS in Lynden, WA
- 10,92071.1%Rescue & EMS
- 1,2418.1%Good Intent Call
- 1,2348.0%Fire
- 7594.9%Service Call
- 5903.8%False Alarm
- 5593.6%Hazardous Condition
- 340.2%Special Incident
- Fire incident types reported to NFIRS in Lynden, WA
- 55745.1%Outside Fires
- 42634.5%Structure Fires
- 13110.6%Mobile Property/Vehicle Fires
- 1209.7%Other
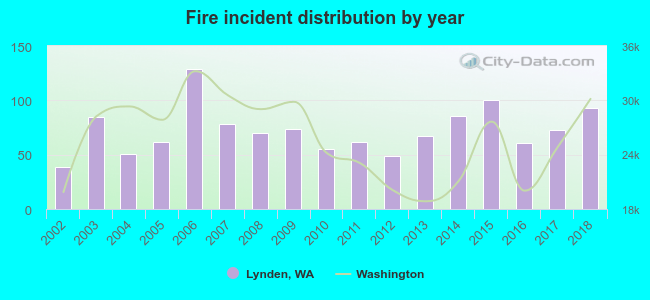 According to the data from the years 2002 - 2018 the average number of fire incidents per year is 73. The highest number of reported fires - 129 took place in 2006, and the least - 39 in 2002. The data has a rising trend.
The average number of yearly fire incidents per 10k residents in Lynden, WA compared to nearest cities:
(Note: Based on data for the last 3 years, including only cities with population 5,000 and above)
| Lynden: | 57.5 |
| Ferndale: | 73.2 |
| Birch Bay: | 8.3 |
| Bellingham: | 23.1 |
| Sudden Valley: | 1.6 |
| Bow: | 14.2 |
| Anacortes: | 66.5 |
| Burlington: | 91.4 |
| Mount Vernon: | 19.3 |
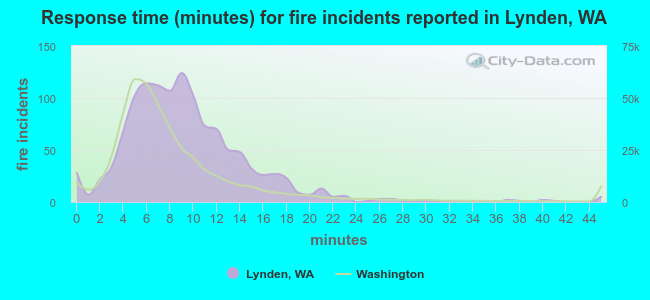 The median response time based on all reported fire incidents is 9 minutes. This is higher than the state median value.
The median response time in Lynden, WA compared to nearest cities:
(Note: Based on data for all years, including only cities with at least 500 fire incidents)
| Lynden: | 9 minutes |
| Ferndale: | 9 minutes |
| Blaine: | 8 minutes |
| Bellingham: | 7 minutes |
| Anacortes: | 7 minutes |
| Burlington: | 6 minutes |
| Mount Vernon: | 7 minutes |
| Oak Harbor: | 5 minutes |
| Stanwood: | 8 minutes |
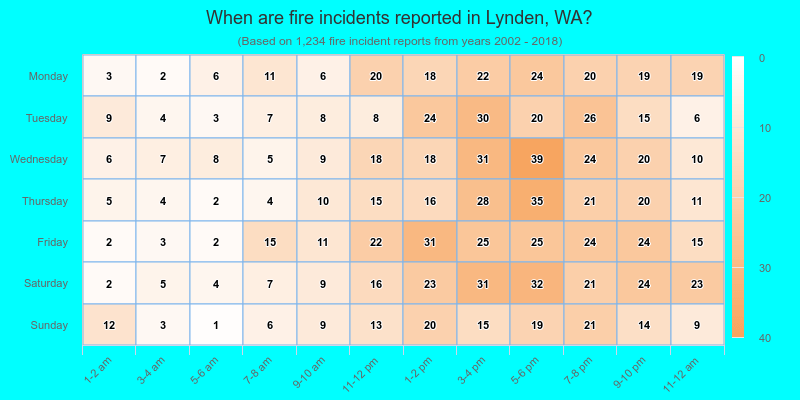
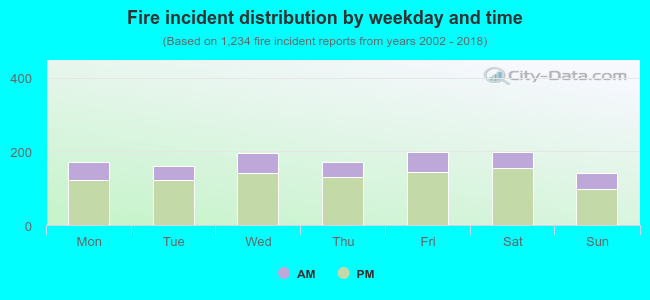 26.1% incidents where reported in the morning and 73.9% in the evening. The most fires (16.1%) took place on Friday, and the least (11.5%) on Sunday.
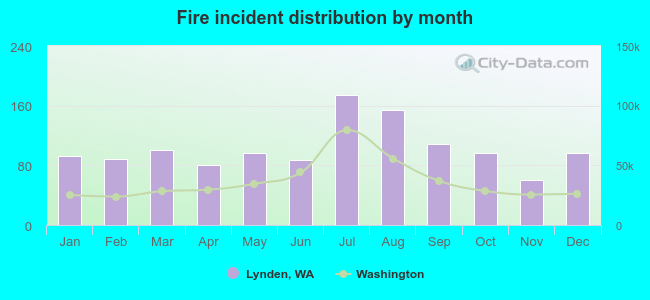 According to the 1,234 fire incident reports from years 2002 - 2018 most fires (14.1%) took place during July, and the least (4.9%) in November.
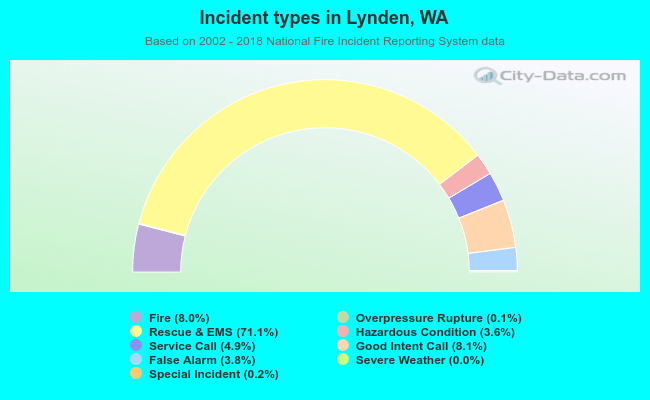 Out of all 15,352 cases reported during the years 2002 - 2018, the most belonged to the categories: Rescue & EMS (71.1%), Good Intent Call (8.1%), and Fire (8.0%).
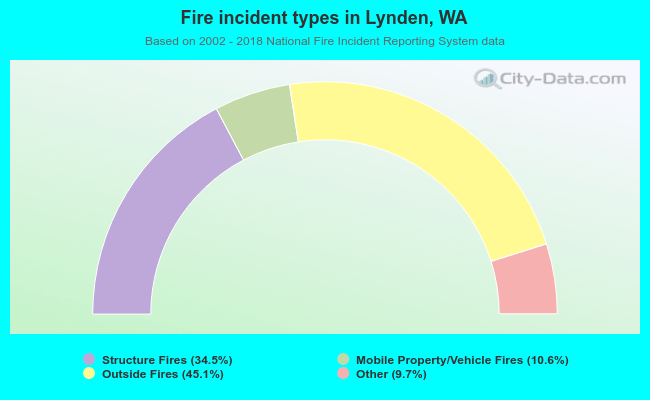 When looking into fire subcategories, the most incidents belonged to: Outside Fires (45.1%), and Structure Fires (34.5%).