Madison: Fire Incidents, South Dakota (SD)
Where are fire incidents reported in Madison, SD
Something went wrong! Please refresh the page.
|
| |||||||||||||||||||||||||||||||||||||||||||||||||||||||||||||||||||||||||||||||||||||||||||||||||||||||||||||
2004 - 2018 National Fire Incident Reporting System (NFIRS) incidents
- Incident types reported to NFIRS in Madison, SD
- 32262.0%Fire
- 8215.8%Hazardous Condition
- 407.7%False Alarm
- 326.2%Rescue & EMS
- 305.8%Good Intent Call
- 81.5%Service Call
- 40.8%Overpressure Rupture
- 10.2%Special Incident
- Fire incident types reported to NFIRS in Madison, SD
- 12739.4%Outside Fires
- 9730.1%Structure Fires
- 7222.4%Mobile Property/Vehicle Fires
- 268.1%Other
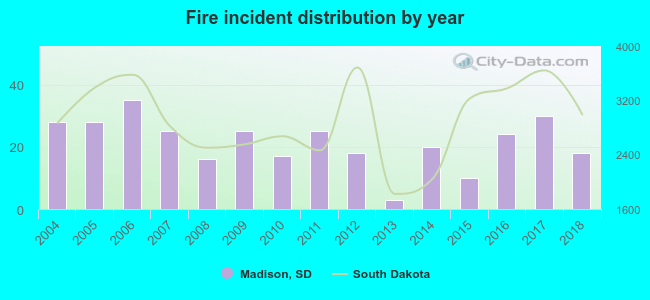 Based on the data from the years 2004 - 2018 the average number of fire incidents per year is 21. The highest number of reported fire incidents - 35 took place in 2006, and the least - 3 in 2013. The data has a decreasing trend.
The average number of yearly fire incidents per 10k residents in Madison, SD compared to nearest cities:
(Note: Based on data for the last 3 years, including only cities with population 5,000 and above)
| Madison: | 33.7 |
| Brookings: | 19.8 |
| Sioux Falls: | 19.9 |
| Brandon: | 31.4 |
| Harrisburg: | 29.5 |
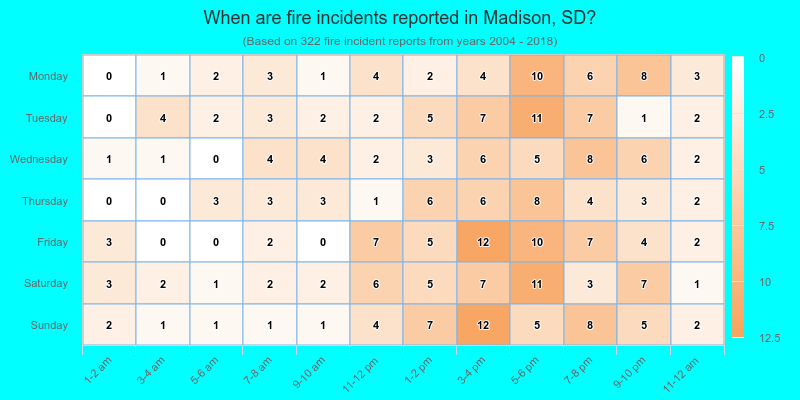
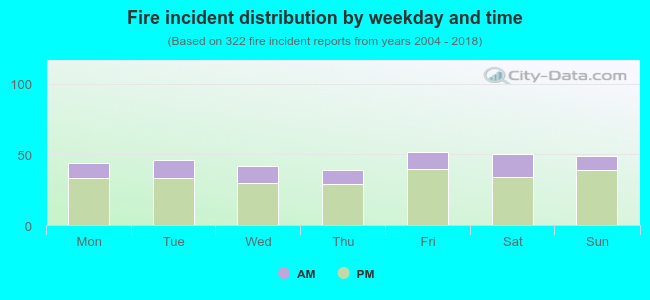 26.1% incidents where reported in the morning and 73.9% in the evening. The most fires (16.1%) took place on Friday, and the least (12.1%) on Thursday.
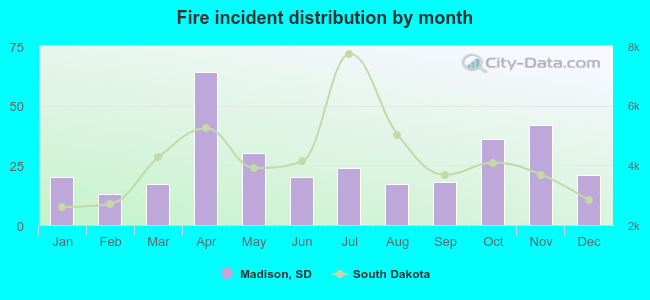 According to the 322 fires from years 2004 - 2018 most fires (19.9%) took place during April, and the least (4.0%) in February.
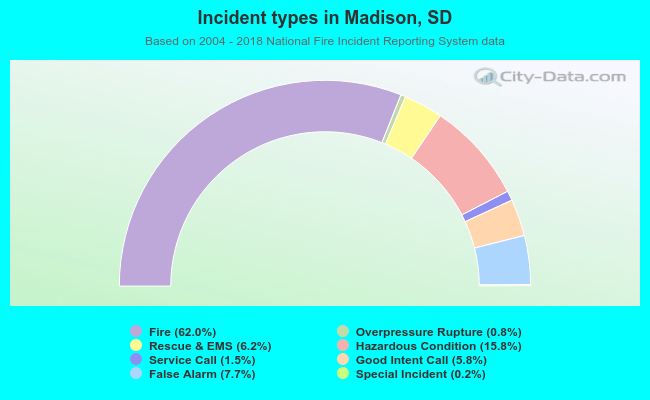 Out of all 519 cases reported during the years 2004 - 2018, the most belonged to the categories: Fire (62.0%), Hazardous Condition (15.8%), and False Alarm (7.7%).
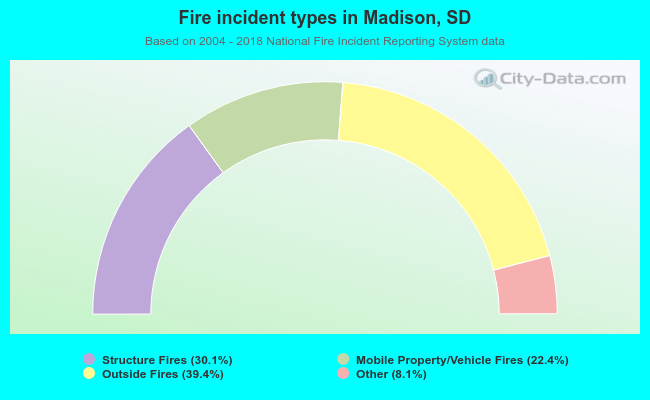 When looking into fire subcategories, the most incidents belonged to: Outside Fires (39.4%), and Structure Fires (30.1%).