Marksville: Fire Incidents, Louisiana (LA)
Where are fire incidents reported in Marksville, LA
Something went wrong! Please refresh the page.
|
| |||||||||||||||||||||||||||||||||||||||||||||||||||||||||||||||||||||||||||||||||||||||||||||||||||||||||||||
2002 - 2018 National Fire Incident Reporting System (NFIRS) incidents
- Incident types reported to NFIRS in Marksville, LA
- 49750.9%Fire
- 23323.8%Hazardous Condition
- 11411.7%Rescue & EMS
- 434.4%Good Intent Call
- 424.3%False Alarm
- 323.3%Service Call
- 131.3%Severe Weather
- 30.3%Overpressure Rupture
- Fire incident types reported to NFIRS in Marksville, LA
- 21643.5%Outside Fires
- 18737.6%Structure Fires
- 7414.9%Mobile Property/Vehicle Fires
- 204.0%Other
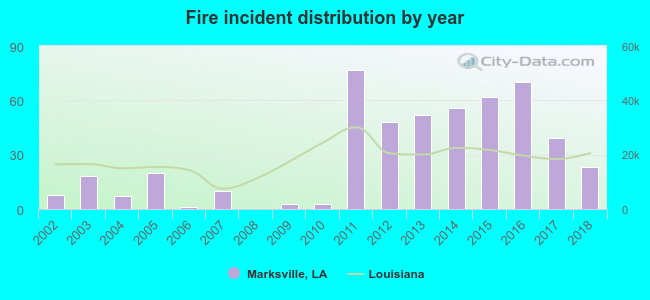 Based on the data from the years 2002 - 2018 the average number of fires per year is 29. The highest number of fires - 77 took place in 2011, and the least - 0 in 2008. The data has a growing trend.
The average number of yearly fire incidents per 10k residents in Marksville, LA compared to nearest cities:
(Note: Based on data for the last 3 years, including only cities with population 5,000 and above)
| Marksville: | 79.2 |
| Pineville: | 155.1 |
| Alexandria: | 83.9 |
| Ville Platte: | 100.2 |
| Oakdale: | 115.7 |
| Opelousas: | 158.9 |
| Eunice: | 91.6 |

 29.6% incidents where reported in the morning and 70.4% in the evening. The most fires (19.5%) took place on Friday, and the least (10.3%) on Sunday.
 According to the 497 fire incidents from years 2002 - 2018 most fires (11.3%) took place during January, and the least (5.2%) in September.
 Out of all 977 cases reported during the years 2002 - 2018, the most belonged to the categories: Fire (50.9%), Hazardous Condition (23.8%), and Rescue & EMS (11.7%).
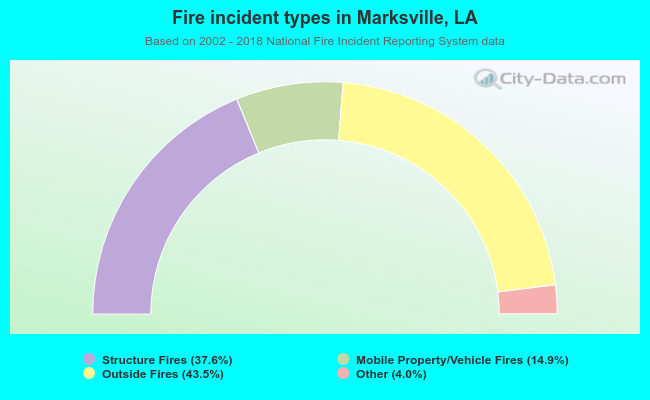 When looking into fire subcategories, the most reports belonged to: Outside Fires (43.5%), and Structure Fires (37.6%).