Oakdale: Fire Incidents, Louisiana (LA)
Where are fire incidents reported in Oakdale, LA
Something went wrong! Please refresh the page.
| Fire incidents reported | |
|---|---|
| Sreet name | Count |
| 7TH AVE | 48 |
| HWY 1153 | 48 |
| 16TH ST | 42 |
| SAM CLOUD RD | 40 |
| 5TH AVE | 36 |
| SAM CLOUD RD | 34 |
| 7TH ST | 30 |
| 165 HWY | 28 |
| JACKSON ST | 26 |
| HWY 165 | 24 |
| 6TH AVE | 22 |
| 6TH ST | 22 |
| RIVER RD | 22 |
| 1153 HWY | 20 |
| 9TH ST | 20 |
| DIXIE ST | 18 |
| 13TH ST | 16 |
| HIGHWAY 1153 | 16 |
| HOSPITAL DR | 16 |
| HWY 10 | 16 |
| 10TH ST | 14 |
| 5TH ST | 14 |
| ALLEN ST | 14 |
| CALVIN WILLIS RD | 14 |
| HIGHWAY 165 | 14 |
| MOWAD ST | 14 |
| 10 HWY | 12 |
| 12TH ST | 12 |
| CYPRESS CREEK RD | 12 |
| HWY 10 WEST | 12 |
| Other | 690 |
2002 - 2018 National Fire Incident Reporting System (NFIRS) incidents
- Incident types reported to NFIRS in Oakdale, LA
- 2,68352.9%Rescue & EMS
- 1,36627.0%Fire
- 66013.0%Hazardous Condition
- 1583.1%False Alarm
- 881.7%Service Call
- 701.4%Good Intent Call
- 210.4%Severe Weather
- 200.4%Special Incident
- Fire incident types reported to NFIRS in Oakdale, LA
- 62445.7%Outside Fires
- 55240.4%Structure Fires
- 15011.0%Mobile Property/Vehicle Fires
- 402.9%Other
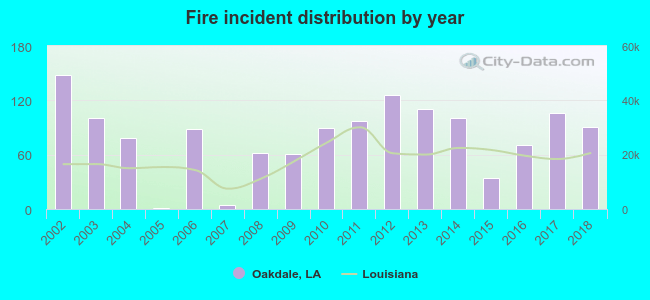 Based on the data from the years 2002 - 2018 the average number of fires per year is 80. The highest number of reported fire incidents - 148 took place in 2002, and the least - 1 in 2005. The data has a declining trend.
The average number of yearly fire incidents per 10k residents in Oakdale, LA compared to nearest cities:
(Note: Based on data for the last 3 years, including only cities with population 5,000 and above)
| Oakdale: | 115.7 |
| Ville Platte: | 100.2 |
| Eunice: | 91.6 |
| Alexandria: | 83.9 |
| Pineville: | 155.1 |
| Opelousas: | 158.9 |
| Jennings: | 52.0 |
| Marksville: | 79.2 |
| Leesville: | 200.7 |
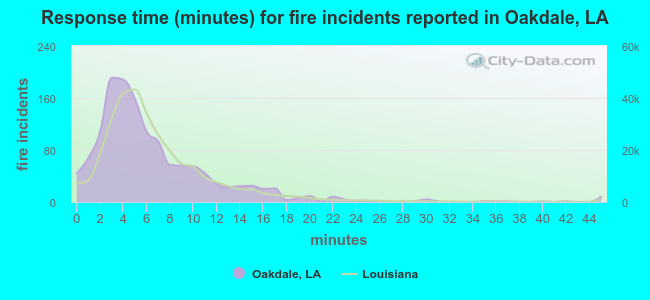 The median response time based on all reported fire incidents is 5 minutes. This is lower than the state median value.
The median response time in Oakdale, LA compared to nearest cities:
(Note: Based on data for all years, including only cities with at least 500 fire incidents)
| Oakdale: | 5 minutes |
| Glenmora: | 9 minutes |
| Ville Platte: | 5 minutes |
| Eunice: | 4 minutes |
| Alexandria: | 5 minutes |
| Church Point: | 7 minutes |
| Pineville: | 6 minutes |
| Opelousas: | 5 minutes |
| Boyce: | 10 minutes |
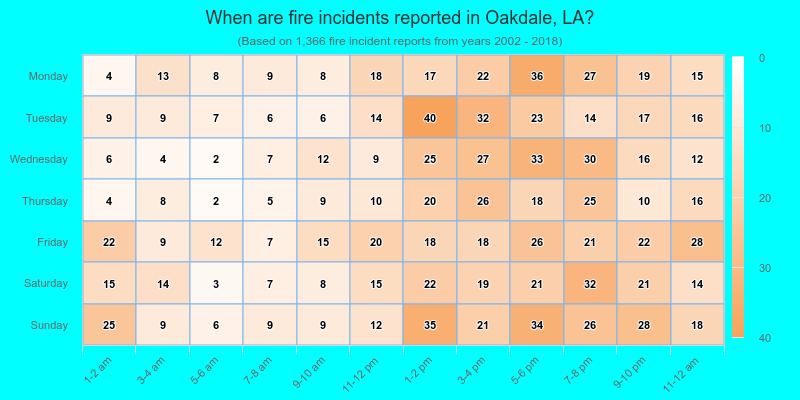
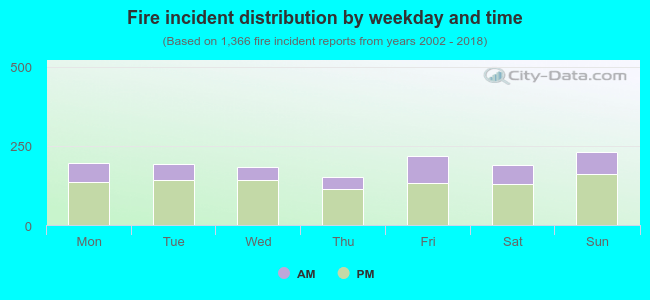 29.7% incidents where reported in the morning and 70.3% in the evening. The most fires (17.0%) took place on Sunday, and the least (11.2%) on Thursday.
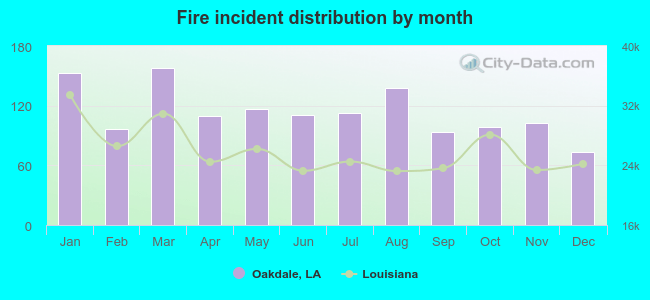 Based on the 1,366 fire incident reports from years 2002 - 2018 most fires (11.6%) took place during March, and the least (5.3%) in December.
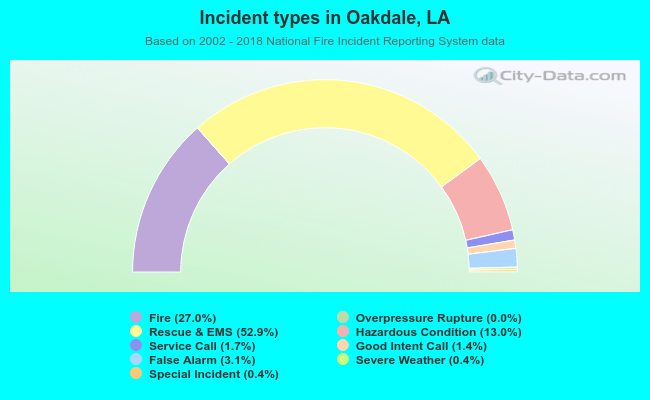 Out of all 5,068 cases reported during the years 2002 - 2018, the most belonged to the categories: Rescue & EMS (52.9%), Fire (27.0%), and Hazardous Condition (13.0%).
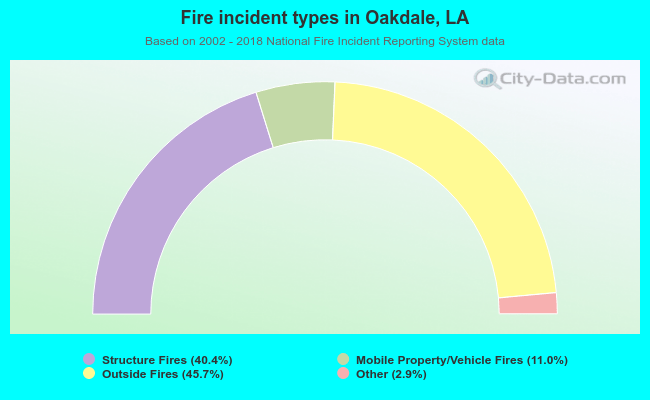 When looking into fire subcategories, the most incidents belonged to: Outside Fires (45.7%), and Structure Fires (40.4%).