Mendon: Fire Incidents, New York (NY)
Where are fire incidents reported in Mendon, NY
Something went wrong! Please refresh the page.
|
| |||||||||||||||||||||||||||||||||||||||||||||||||||||||||||||||||||||||||||||||||||||||||||||||||||||||||||||
2003 - 2018 National Fire Incident Reporting System (NFIRS) incidents
- Incident types reported to NFIRS in Mendon, NY
- 58944.5%Rescue & EMS
- 24718.6%Hazardous Condition
- 20015.1%False Alarm
- 1007.5%Fire
- 987.4%Service Call
- 816.1%Good Intent Call
- 60.5%Severe Weather
- 20.2%Overpressure Rupture
- 20.2%Special Incident
- Fire incident types reported to NFIRS in Mendon, NY
- 5151.0%Structure Fires
- 3030.0%Outside Fires
- 1010.0%Other
- 99.0%Mobile Property/Vehicle Fires
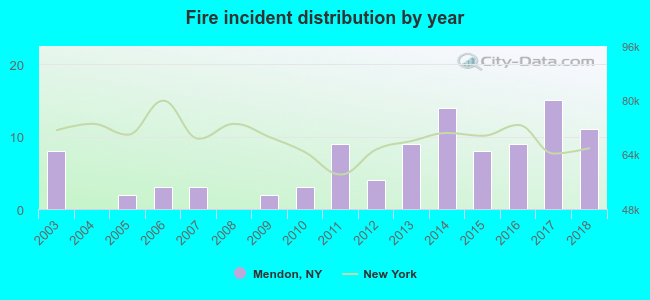 According to the data from the years 2003 - 2018 the average number of fire incidents per year is 6. The highest number of reported fires - 15 took place in 2017, and the least - 0 in 2004. The data has a growing trend.
The average number of yearly fire incidents per 10k residents in Mendon, NY compared to nearest cities:
(Note: Based on data for the last 3 years, including only cities with population 5,000 and above)
| Mendon: | 12.7 |
| Henrietta: | 7.2 |
| Perinton: | 2.3 |
| East Rochester: | 31.3 |
| Brighton: | 1.6 |
| Fairport: | 126.0 |
| Farmington: | 38.3 |
| Chili: | 0.7 |
| Penfield: | 21.2 |
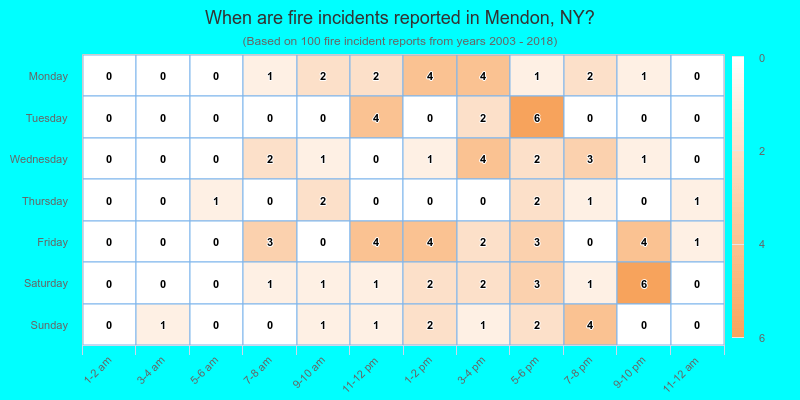
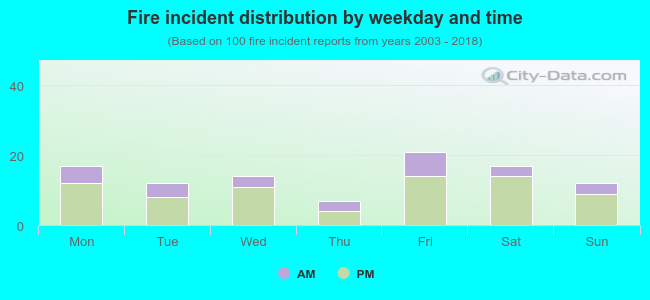 28.0% incidents where reported in the morning and 72.0% in the evening. The most fires (21.0%) took place on Friday, and the least (7.0%) on Thursday.
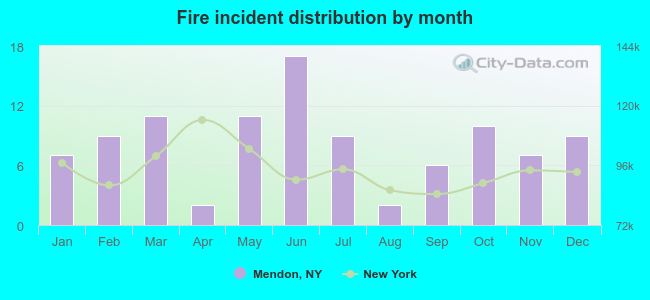 Based on the 100 fire incident reports from years 2003 - 2018 most fires (17.0%) took place during June, and the least (2.0%) in April.
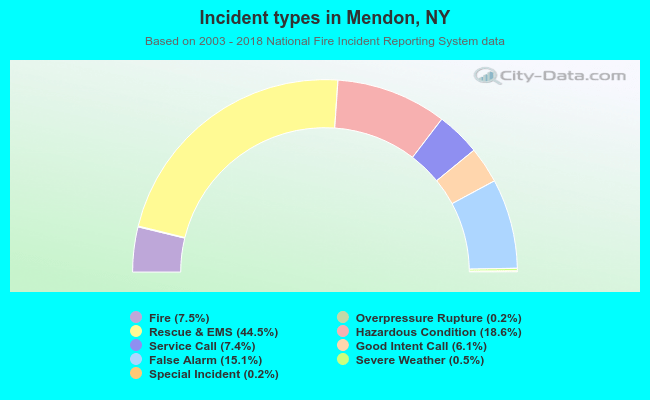 Out of all 1,325 cases reported during the years 2003 - 2018, the most belonged to the categories: Rescue & EMS (44.5%), Hazardous Condition (18.6%), and False Alarm (15.1%).
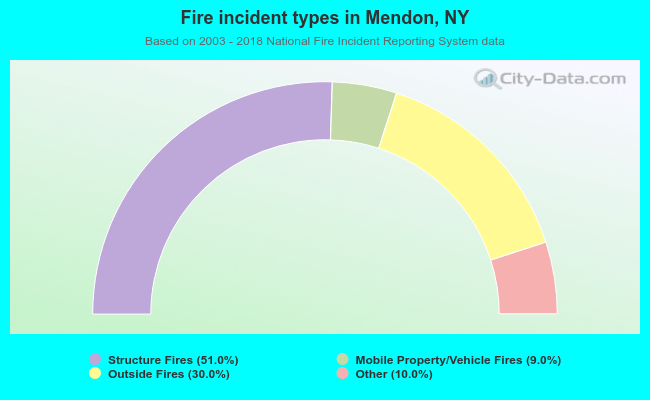 When looking into fire subcategories, the most reports belonged to: Structure Fires (51.0%), and Outside Fires (30.0%).