Monroe: Fire Incidents, Washington (WA)
Where are fire incidents reported in Monroe, WA
Something went wrong! Please refresh the page.
|
| |||||||||||||||||||||||||||||||||||||||||||||||||||||||||||||||||||||||||||||||||||||||||||||||||||||||||||||
2002 - 2018 National Fire Incident Reporting System (NFIRS) incidents
- Incident types reported to NFIRS in Monroe, WA
- 3,98150.9%Rescue & EMS
- 1,25916.1%Good Intent Call
- 1,01713.0%Fire
- 7659.8%Service Call
- 6017.7%Hazardous Condition
- 1992.5%False Alarm
- Fire incident types reported to NFIRS in Monroe, WA
- 48247.4%Structure Fires
- 35334.7%Outside Fires
- 12812.6%Mobile Property/Vehicle Fires
- 545.3%Other
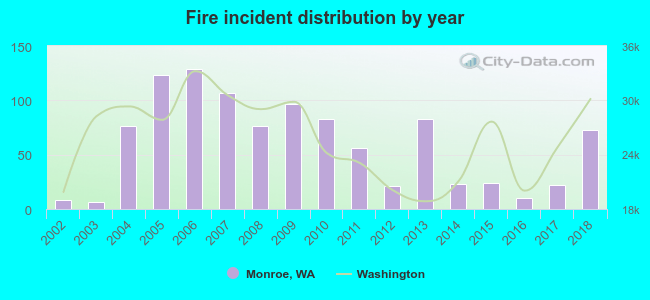 Based on the data from the years 2002 - 2018 the average number of fires per year is 60. The highest number of fire incidents - 129 took place in 2006, and the least - 6 in 2003. The data has an increasing trend.
The average number of yearly fire incidents per 10k residents in Monroe, WA compared to nearest cities:
(Note: Based on data for the last 3 years, including only cities with population 5,000 and above)
| Monroe: | 19.6 |
| Snohomish: | 98.1 |
| Duvall: | 28.4 |
| Mill Creek: | 10.8 |
| Woodinville: | 16.1 |
| Bothell: | 32.5 |
| Lake Stevens: | 27.2 |
| Everett: | 40.3 |
| Brier: | 10.4 |
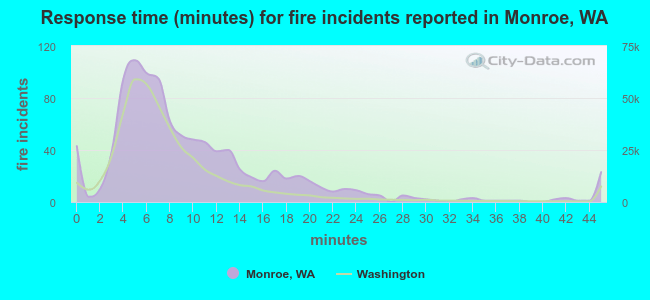 The median response time based on all reported fire incidents is 8 minutes. This is about the same as the state median value.
The median response time in Monroe, WA compared to nearest cities:
(Note: Based on data for all years, including only cities with at least 500 fire incidents)
| Monroe: | 8 minutes |
| Snohomish: | 8 minutes |
| Sultan: | 8 minutes |
| Woodinville: | 7 minutes |
| Bothell: | 6 minutes |
| Lake Stevens: | 8 minutes |
| Everett: | 6 minutes |
| Kenmore: | 6 minutes |
| Redmond: | 6 minutes |
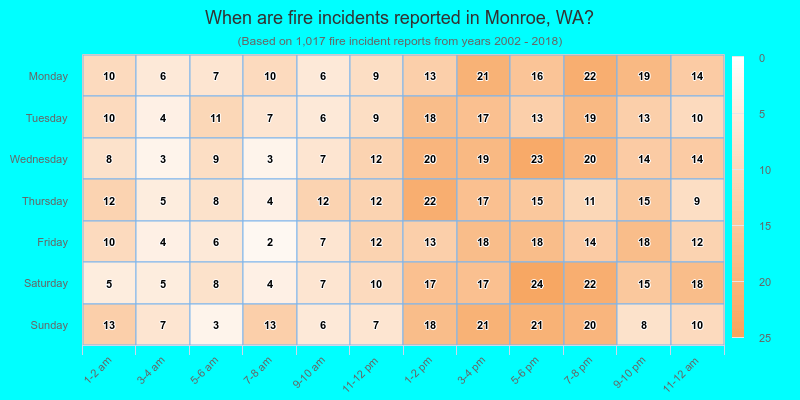
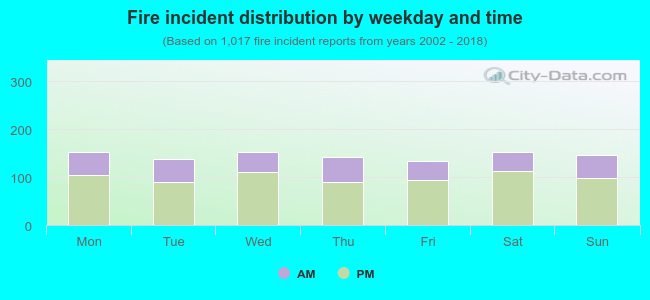 31.4% incidents where reported in the morning and 68.6% in the evening. The most fires (15.0%) took place on Monday, and the least (13.2%) on Friday.
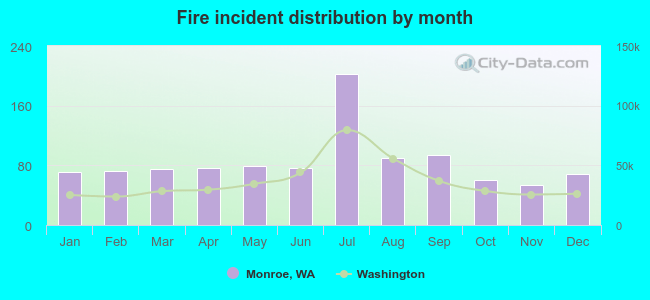 According to the 1,017 fire incident reports from years 2002 - 2018 most fires (19.9%) took place during July, and the least (5.2%) in November.
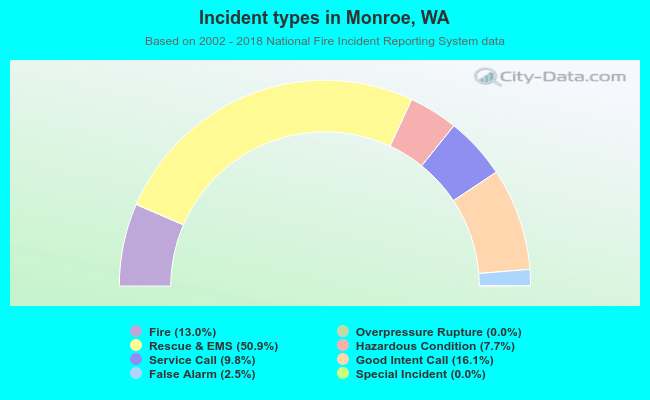 Out of all 7,827 cases reported during the years 2002 - 2018, the most belonged to the categories: Rescue & EMS (50.9%), Good Intent Call (16.1%), and Fire (13.0%).
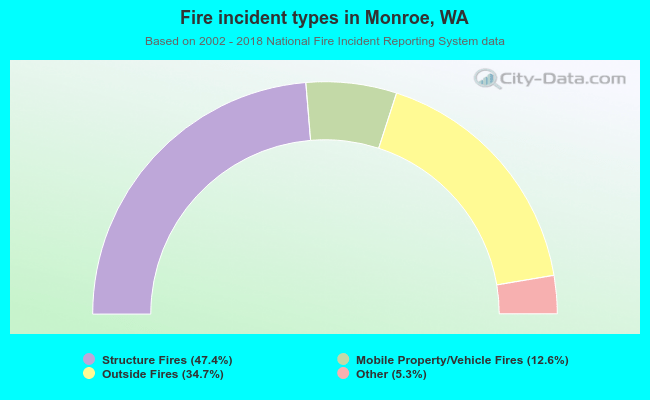 When looking into fire subcategories, the most reports belonged to: Structure Fires (47.4%), and Outside Fires (34.7%).