Navarre: Fire Incidents, Florida (FL)
Where are fire incidents reported in Navarre, FL
Something went wrong! Please refresh the page.
| Fire incidents reported | |
|---|---|
| Sreet name | Count |
| OUT OF DISTRICT | 176 |
| NAVARRE PKWY. | 148 |
| NAVARRE PKY | 120 |
| GULF BLVD | 110 |
| HWY 87 | 70 |
| EAST BAY BLVD | 58 |
| NAVARRE PKWY | 52 |
| AVENIDA DE SOL | 40 |
| ORTEGA ST | 40 |
| SUNSET DR. | 36 |
| TIMBER LN. | 32 |
| ANDORRA ST. | 28 |
| SEVILLA ST. | 28 |
| DEER LN. | 24 |
| FRONTERA ST. | 24 |
| QUAIL ROOST DR. | 24 |
| SALAMANCA ST | 24 |
| TORTUGA ST. | 24 |
| EAST BAY BLVD | 22 |
| MOLINA ST. | 22 |
| PRESIDIO ST | 22 |
| BLACK JACK CIR. | 20 |
| MILITARY TRAIL | 20 |
| PANHANDLE TR. | 20 |
| SANDSTONE RD. | 20 |
| WINDTRACE RD. NORTH | 20 |
| CALLE MIO | 18 |
| INDIGO DR | 18 |
| SEGURA ST. | 18 |
| TOLEDO ST | 18 |
| Other | 965 |
2002 - 2018 National Fire Incident Reporting System (NFIRS) incidents
- Incident types reported to NFIRS in Navarre, FL
- 9,91054.1%Rescue & EMS
- 3,13417.1%Good Intent Call
- 2,26112.3%Fire
- 1,2777.0%Service Call
- 1,0135.5%False Alarm
- 6703.7%Hazardous Condition
- Fire incident types reported to NFIRS in Navarre, FL
- 1,11849.4%Outside Fires
- 89839.7%Structure Fires
- 1727.6%Mobile Property/Vehicle Fires
- 733.2%Other
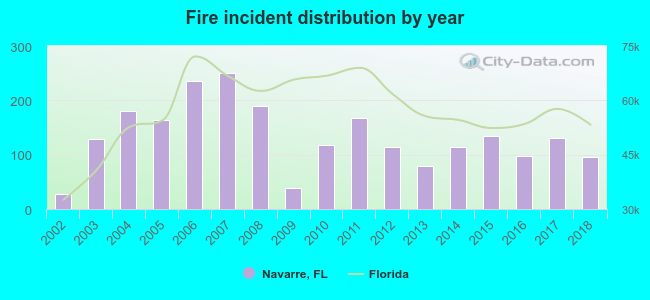 Based on the data from the years 2002 - 2018 the average number of fires per year is 133. The highest number of reported fires - 250 took place in 2007, and the least - 27 in 2002. The data has an increasing trend.
The average number of yearly fire incidents per 10k residents in Navarre, FL compared to nearest cities:
(Note: Based on data for the last 3 years, including only cities with population 5,000 and above)
| Navarre: | 34.4 |
| Fort Walton Beach: | 85.5 |
| Ocean City: | 7.2 |
| East Milton: | 21.7 |
| Gulf Breeze: | 138.8 |
| Milton: | 364.9 |
| Eglin: | 1.6 |
| Pensacola: | 189.1 |
| Pace: | 72.2 |
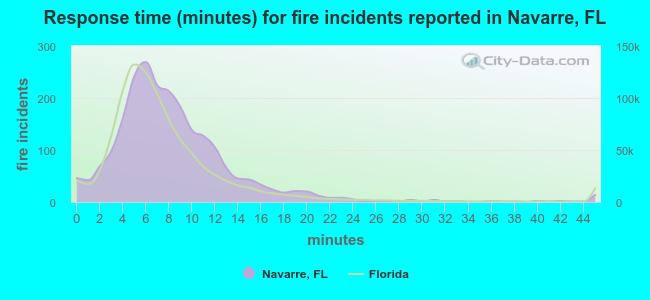 The median response time based on all reported fire incidents is 7 minutes. This is similar to the state median value.
The median response time in Navarre, FL compared to nearest cities:
(Note: Based on data for all years, including only cities with at least 500 fire incidents)
| Navarre: | 7 minutes |
| Mary Esther: | 6 minutes |
| Fort Walton Beach: | 6 minutes |
| Gulf Breeze: | 7 minutes |
| Milton: | 8 minutes |
| Pensacola: | 6 minutes |
| Pace: | 8 minutes |
| Destin: | 6 minutes |
| Niceville: | 5 minutes |
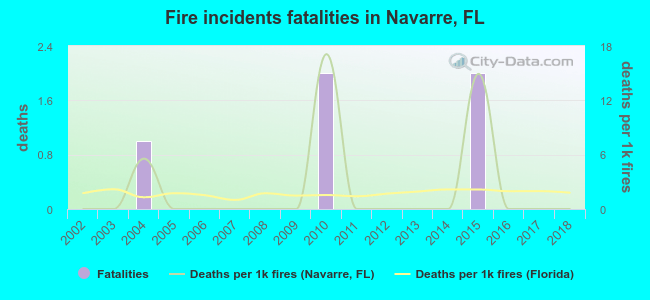 According to the data from the years 2002 - 2018 the average number of fire-related fatalities per year is 0. The highest number of deaths - 2 took place in 2010, and the lowest - 0 in 2002. The data has a constant trend.
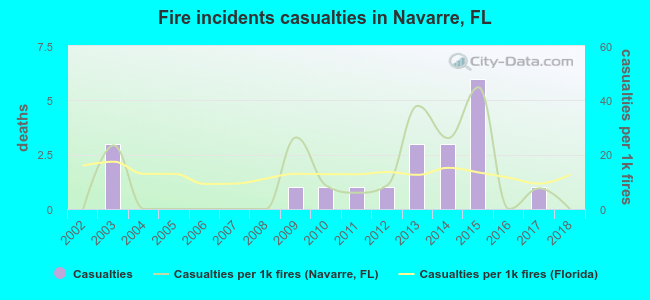 Based on the reports from the years 2002 - 2018 the average number of fire-related casualties per year is 1. The highest number of casualties - 6 took place in 2015, and the lowest - 0 in 2002. The data has a constant trend.
The average number of injuries per 1,000 fires is 11. This indicator was the highest - 45 in 2015, and the lowest 0 in 2002. The trend for casualties per 1,000 fire incidents is rising. Compared to the state value the number of injuries per 1,000 incidents is lower.
Based on the reports from the years 2002 - 2018 the average number of fire-related casualties per year is 1. The highest number of casualties - 6 took place in 2015, and the lowest - 0 in 2002. The data has a constant trend.
The average number of injuries per 1,000 fires is 11. This indicator was the highest - 45 in 2015, and the lowest 0 in 2002. The trend for casualties per 1,000 fire incidents is rising. Compared to the state value the number of injuries per 1,000 incidents is lower.Casualties per 1,000 incidents in Navarre, FL compared to nearest cities:
(Note: Based on data for all years, including only cities with at least 500 fire incidents)
| Navarre: | 8.8 |
| Mary Esther: | 3.5 |
| Fort Walton Beach: | 9.1 |
| Gulf Breeze: | 9.2 |
| Milton: | 5.1 |
| Pensacola: | 13.2 |
| Pace: | 18.7 |
| Destin: | 5.2 |
| Niceville: | 12.5 |
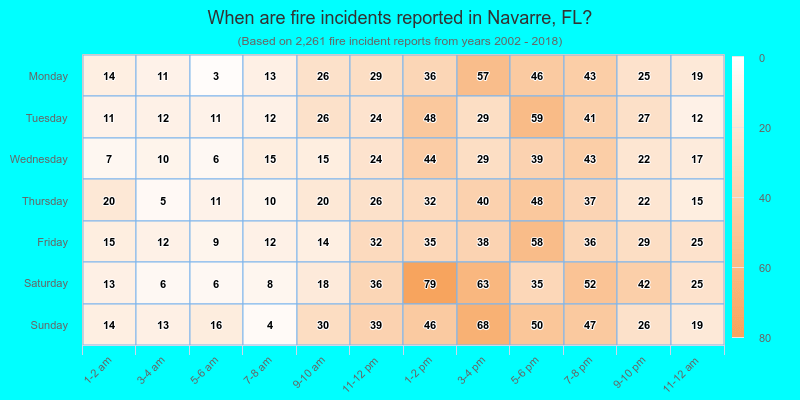
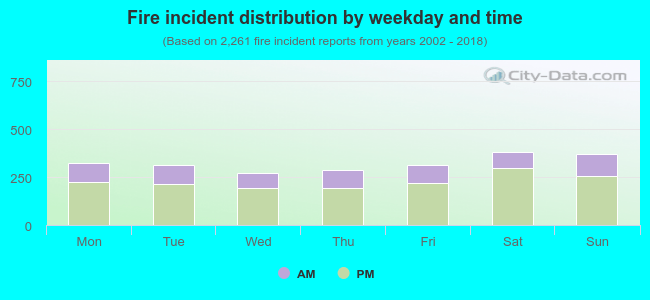 29.1% incidents where reported in the morning and 70.9% in the evening. The most fires (16.9%) took place on Saturday, and the least (12.0%) on Wednesday.
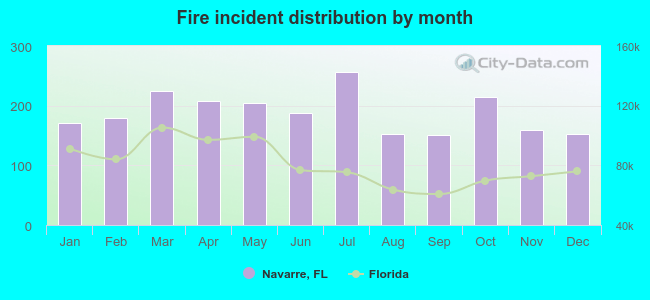 Based on the 2,261 fire incidents from years 2002 - 2018 most fires (11.3%) took place during July, and the least (6.7%) in September.
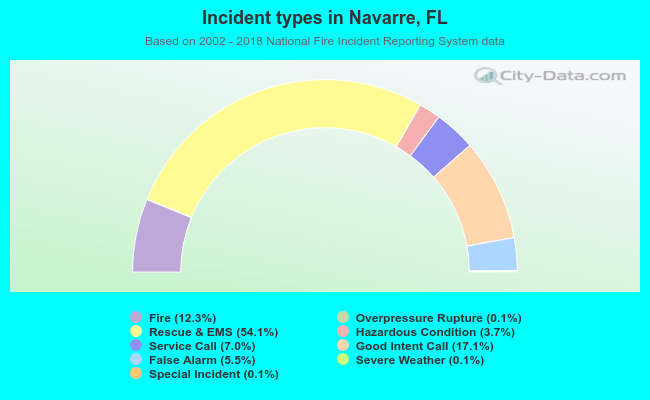 Out of all 18,311 cases reported during the years 2002 - 2018, the most belonged to the categories: Rescue & EMS (54.1%), Good Intent Call (17.1%), and Fire (12.3%).
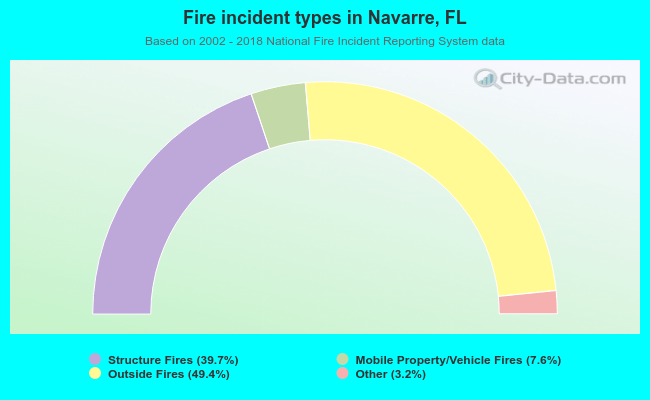 When looking into fire subcategories, the most reports belonged to: Outside Fires (49.4%), and Structure Fires (39.7%).