Pensacola: Fire Incidents, Florida (FL)
Where are fire incidents reported in Pensacola, FL
Something went wrong! Please refresh the page.
| Fire incidents reported | |
|---|---|
| Sreet name | Count |
| FAIRFIELD DR | 550 |
| MOBILE HWY | 484 |
| PALAFOX ST | 482 |
| NINE MILE RD | 376 |
| DAVIS HWY | 342 |
| 9TH AVE | 328 |
| NAVY BLVD | 278 |
| PENSACOLA BLVD | 272 |
| CERVANTES ST | 266 |
| PACE BLVD | 260 |
| 9TH AV | 254 |
| LILLIAN HWY | 254 |
| JACKSON ST | 252 |
| OLIVE RD | 242 |
| PINE FOREST RD | 240 |
| BLUE ANGEL PKY | 238 |
| SCENIC HWY | 218 |
| CREIGHTON RD | 206 |
| OLD CORRY FIELD RD | 206 |
| BAYOU BLVD | 184 |
| GULF BEACH HWY | 170 |
| JOHNSON AVE | 168 |
| W ST | 168 |
| MICHIGAN AVE | 162 |
| HIGHWAY 98 | 158 |
| PERDIDO KEY DR | 158 |
| AIRPORT BLVD | 156 |
| GREGORY ST | 144 |
| SAUFLEY FIELD RD | 138 |
| MASSACHUSETTS AVE | 130 |
| Other | 9,117 |
2002 - 2018 National Fire Incident Reporting System (NFIRS) incidents
- Incident types reported to NFIRS in Pensacola, FL
- 48,88142.3%Rescue & EMS
- 16,60114.4%Fire
- 14,05512.2%Hazardous Condition
- 13,43611.6%Service Call
- 11,76710.2%Good Intent Call
- 10,4949.1%False Alarm
- 1530.1%Overpressure Rupture
- 1360.1%Severe Weather
- Fire incident types reported to NFIRS in Pensacola, FL
- 7,79847.0%Outside Fires
- 5,25931.7%Structure Fires
- 2,35914.2%Mobile Property/Vehicle Fires
- 1,1857.1%Other
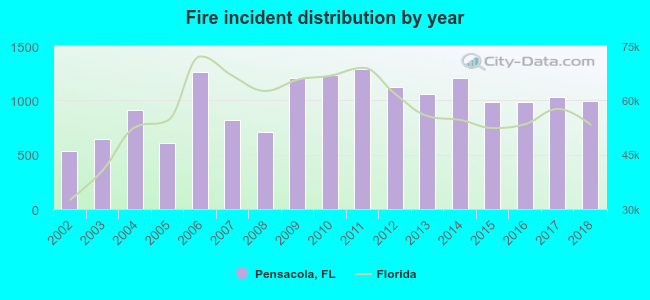 According to the data from the years 2002 - 2018 the average number of fire incidents per year is 977. The highest number of reported fires - 1,292 took place in 2011, and the least - 533 in 2002. The data has a growing trend.
The average number of yearly fire incidents per 10k residents in Pensacola, FL compared to nearest cities:
(Note: Based on data for the last 3 years, including only cities with population 5,000 and above)
| Pensacola: | 189.1 |
| West Pensacola: | 0.5 |
| Brent: | 0.5 |
| Gulf Breeze: | 138.8 |
| Cantonment: | 14.9 |
| Pace: | 72.2 |
| Milton: | 364.9 |
| East Milton: | 21.7 |
| Navarre: | 34.4 |
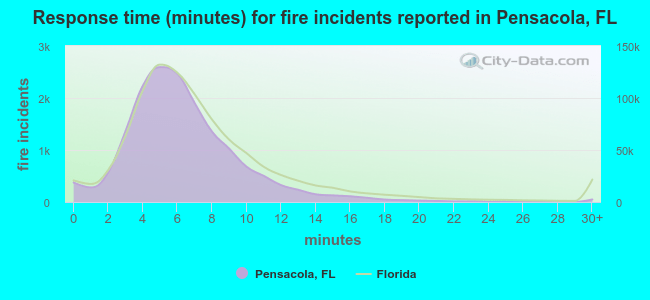 The median response time based on all reported fire incidents is 6 minutes. This is similar to the Florida median value.
The median response time in Pensacola, FL compared to nearest cities:
(Note: Based on data for all years, including only cities with at least 500 fire incidents)
| Pensacola: | 6 minutes |
| Gulf Breeze: | 7 minutes |
| Cantonment: | 8 minutes |
| Pace: | 8 minutes |
| Milton: | 8 minutes |
| Navarre: | 7 minutes |
| Orange Beach: | 5 minutes |
| Foley: | 7 minutes |
| Gulf Shores: | 5 minutes |
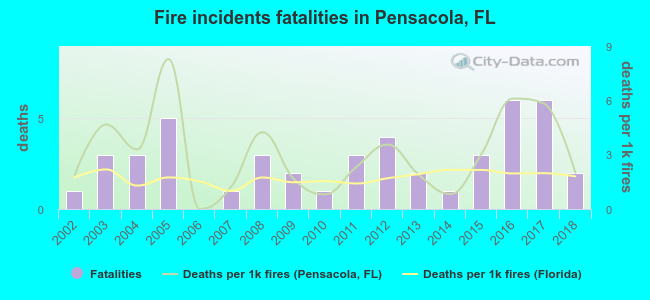 Based on the reports from the years 2002 - 2018 the average number of fire-related fatalities per year is 3. The highest number of deaths - 6 took place in 2016, and the lowest - 0 in 2006. The data has a growing trend.
The average number of fatalities per 1,000 fire incidents is 3. This indicator was the highest - 8 in 2005, and the lowest 0 in 2006. The trend for deaths per 1,000 fires is increasing. Compared to the Florida value the number of fatalities per 1,000 fire incidents is higher.
Based on the reports from the years 2002 - 2018 the average number of fire-related fatalities per year is 3. The highest number of deaths - 6 took place in 2016, and the lowest - 0 in 2006. The data has a growing trend.
The average number of fatalities per 1,000 fire incidents is 3. This indicator was the highest - 8 in 2005, and the lowest 0 in 2006. The trend for deaths per 1,000 fires is increasing. Compared to the Florida value the number of fatalities per 1,000 fire incidents is higher.
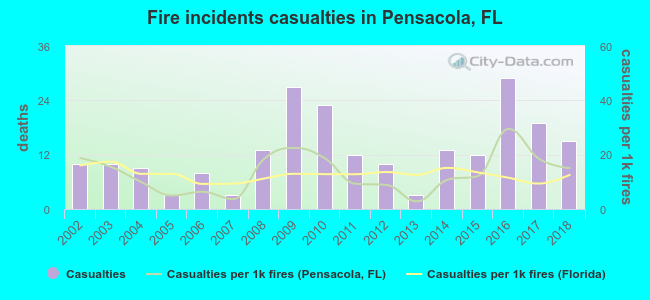 According to the data from the years 2002 - 2018 the average number of fire-related yearly casualties is 13. The highest number of casualties - 29 took place in 2016, and the lowest - 3 in 2005. The data has an increasing trend.
The average number of casualties per 1,000 fires is 13. This indicator was the highest - 29 in 2016, and the lowest 3 in 2013. The trend for injuries per 1,000 incidents is declining. Compared to the Florida value the number of casualties per 1,000 fires is about the same.
According to the data from the years 2002 - 2018 the average number of fire-related yearly casualties is 13. The highest number of casualties - 29 took place in 2016, and the lowest - 3 in 2005. The data has an increasing trend.
The average number of casualties per 1,000 fires is 13. This indicator was the highest - 29 in 2016, and the lowest 3 in 2013. The trend for injuries per 1,000 incidents is declining. Compared to the Florida value the number of casualties per 1,000 fires is about the same.Casualties per 1,000 incidents in Pensacola, FL compared to nearest cities:
(Note: Based on data for all years, including only cities with at least 500 fire incidents)
| Pensacola: | 13.2 |
| Gulf Breeze: | 9.2 |
| Cantonment: | 2.1 |
| Pace: | 18.7 |
| Milton: | 5.1 |
| Navarre: | 8.8 |
| Orange Beach: | 2.6 |
| Foley: | 3.9 |
| Gulf Shores: | 0.9 |
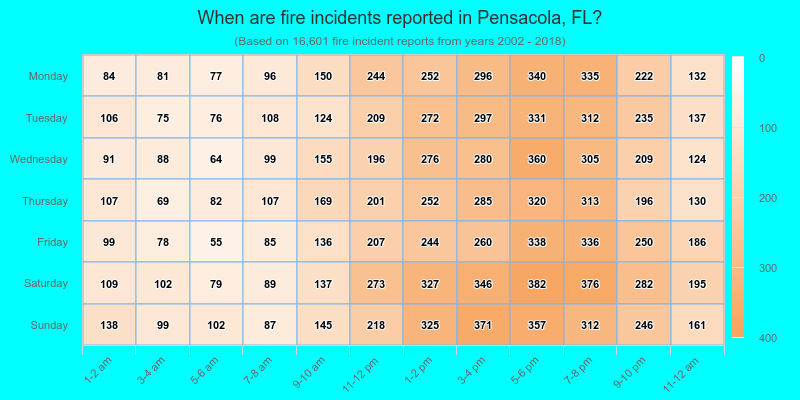
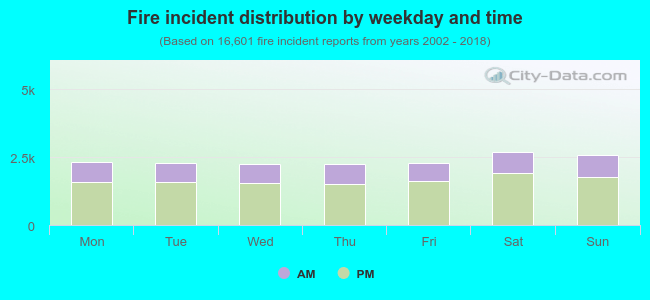 30.7% incidents where reported in the morning and 69.3% in the evening. The most fires (16.2%) took place on Saturday, and the least (13.4%) on Thursday.
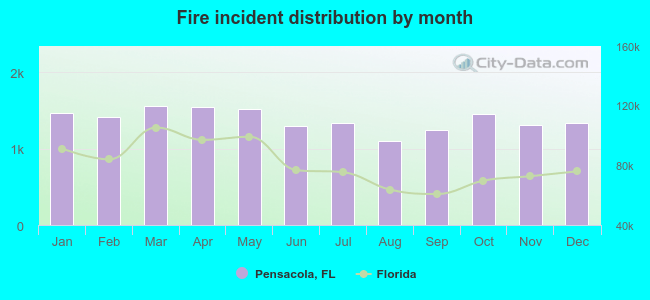 Based on the 16,601 fires from years 2002 - 2018 most fires (9.4%) took place during March, and the least (6.6%) in August.
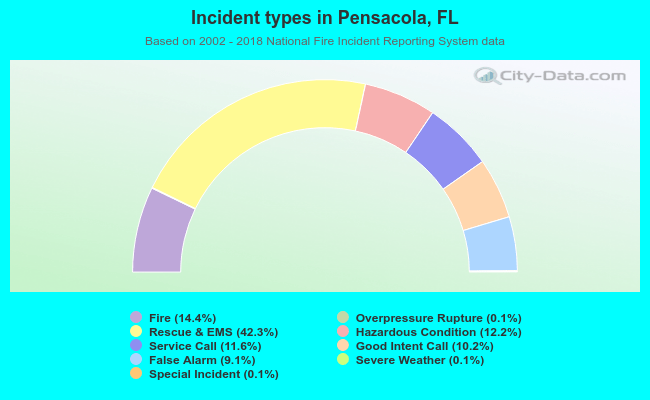 Out of all 115,612 cases reported during the years 2002 - 2018, the most belonged to the categories: Rescue & EMS (42.3%), Fire (14.4%), and Hazardous Condition (12.2%).
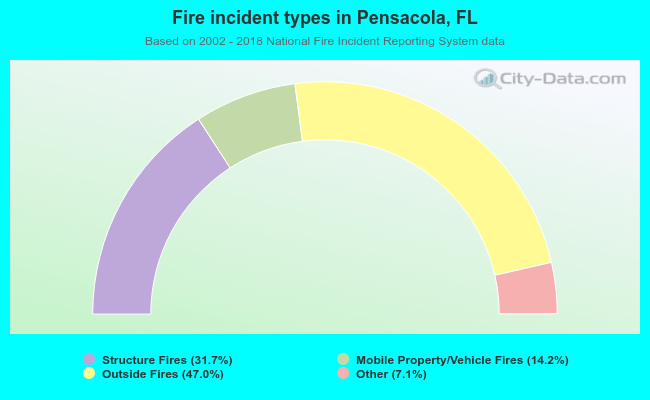 When looking into fire subcategories, the most incidents belonged to: Outside Fires (47.0%), and Structure Fires (31.7%).