Pace: Fire Incidents, Florida (FL)
Where are fire incidents reported in Pace, FL
Something went wrong! Please refresh the page.
| Fire incidents reported | |
|---|---|
| Sreet name | Count |
| HIGHWAY 90 | 324 |
| CHUMUCKLA HWY | 110 |
| HWY 90 | 90 |
| JERNIGAN RD | 88 |
| 90 HWY | 82 |
| SPENCER FIELD RD | 72 |
| WOODBINE RD | 72 |
| DIAMOND ST | 66 |
| GUERNSEY RD | 54 |
| FLORIDATOWN RD | 50 |
| FOWLER DR | 48 |
| CHARLES CIR | 46 |
| QUINTETTE RD | 40 |
| AVENIDA DE GOLF | 38 |
| STEPHENS RD | 38 |
| YANCY DR | 38 |
| JENNY CIR | 36 |
| WILLARD NORRIS RD | 36 |
| LEGEND CREEK DR | 32 |
| FOREST CREEK DR | 30 |
| PACE LANE | 30 |
| BELL RIDGE LN | 28 |
| BERRYHILL RD | 28 |
| LAWRENCE AVE | 28 |
| MADISON AVE | 28 |
| SCOTTSDALE AVE | 28 |
| INDIAN HILLS DR | 26 |
| KEYSER LANE | 26 |
| OAKLEAF DR | 26 |
| POLKS AVE | 26 |
| Other | 1,226 |
2002 - 2018 National Fire Incident Reporting System (NFIRS) incidents
- Incident types reported to NFIRS in Pace, FL
- 8,41051.1%Rescue & EMS
- 2,89017.5%Fire
- 2,09212.7%Good Intent Call
- 1,5959.7%Hazardous Condition
- 7804.7%Service Call
- 6323.8%False Alarm
- 370.2%Severe Weather
- 300.2%Special Incident
- Fire incident types reported to NFIRS in Pace, FL
- 1,53353.0%Outside Fires
- 1,06536.9%Structure Fires
- 2619.0%Mobile Property/Vehicle Fires
- 311.1%Other
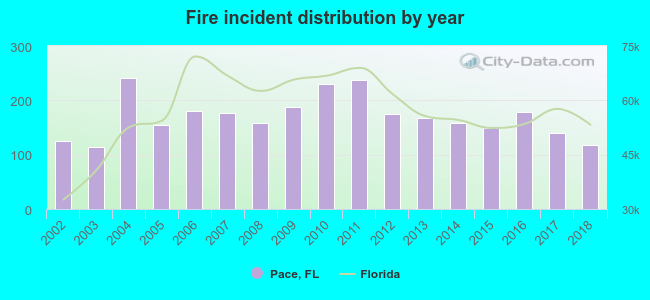 According to the data from the years 2002 - 2018 the average number of fire incidents per year is 170. The highest number of fires - 241 took place in 2004, and the least - 114 in 2003. The data has a decreasing trend.
The average number of yearly fire incidents per 10k residents in Pace, FL compared to nearest cities:
(Note: Based on data for the last 3 years, including only cities with population 5,000 and above)
| Pace: | 72.2 |
| Milton: | 364.9 |
| East Milton: | 21.7 |
| Cantonment: | 14.9 |
| Brent: | 0.5 |
| Pensacola: | 189.1 |
| West Pensacola: | 0.5 |
| Gulf Breeze: | 138.8 |
| Navarre: | 34.4 |
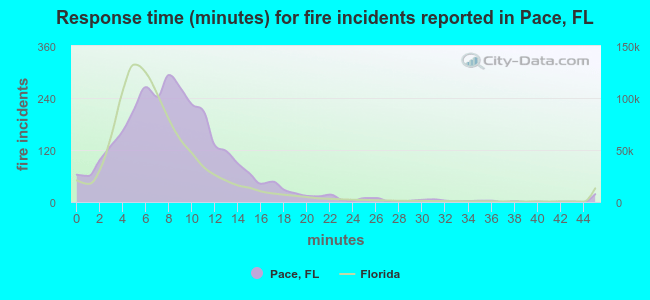 The median response time based on all reported fire incidents is 8 minutes. This is higher than the state median value.
The median response time in Pace, FL compared to nearest cities:
(Note: Based on data for all years, including only cities with at least 500 fire incidents)
| Pace: | 8 minutes |
| Milton: | 8 minutes |
| Cantonment: | 8 minutes |
| Pensacola: | 6 minutes |
| Gulf Breeze: | 7 minutes |
| Navarre: | 7 minutes |
| Mary Esther: | 6 minutes |
| Orange Beach: | 5 minutes |
| Foley: | 7 minutes |
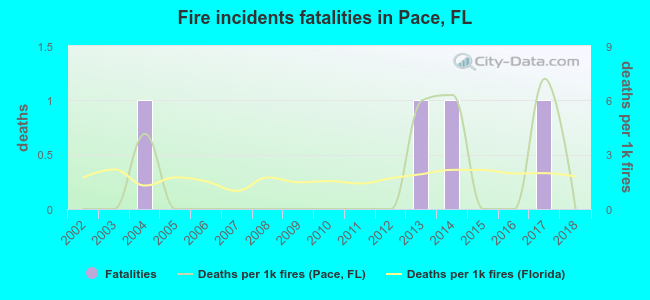 Based on the reports from the years 2002 - 2018 the average number of fire-related fatalities per year is 0. The highest number of reported deaths - 1 took place in 2004, and the lowest - 0 in 2002. The data has a constant trend.
The average number of fatalities per 1,000 fires is 1. This indicator was the highest - 7 in 2017, and the lowest 0 in 2002. The trend for deaths per 1,000 fires is constant. Compared to the Florida value the number of fatalities per 1,000 fire incidents is lower.
Based on the reports from the years 2002 - 2018 the average number of fire-related fatalities per year is 0. The highest number of reported deaths - 1 took place in 2004, and the lowest - 0 in 2002. The data has a constant trend.
The average number of fatalities per 1,000 fires is 1. This indicator was the highest - 7 in 2017, and the lowest 0 in 2002. The trend for deaths per 1,000 fires is constant. Compared to the Florida value the number of fatalities per 1,000 fire incidents is lower.
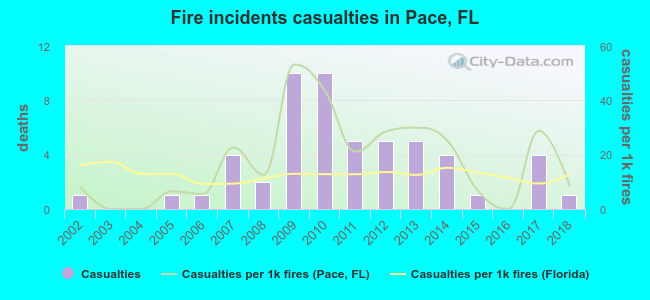 Based on the data from the years 2002 - 2018 the average number of fire-related yearly casualties is 3. The highest number of reported casualties - 10 took place in 2009, and the lowest - 0 in 2003. The data has a constant trend.
The average number of injuries per 1,000 fires is 18. This indicator was the highest - 53 in 2009, and the lowest 0 in 2003. The trend for casualties per 1,000 fires is rising. Compared to the Florida value the number of injuries per 1,000 fires is higher.
Based on the data from the years 2002 - 2018 the average number of fire-related yearly casualties is 3. The highest number of reported casualties - 10 took place in 2009, and the lowest - 0 in 2003. The data has a constant trend.
The average number of injuries per 1,000 fires is 18. This indicator was the highest - 53 in 2009, and the lowest 0 in 2003. The trend for casualties per 1,000 fires is rising. Compared to the Florida value the number of injuries per 1,000 fires is higher.Casualties per 1,000 incidents in Pace, FL compared to nearest cities:
(Note: Based on data for all years, including only cities with at least 500 fire incidents)
| Pace: | 18.7 |
| Milton: | 5.1 |
| Cantonment: | 2.1 |
| Pensacola: | 13.2 |
| Gulf Breeze: | 9.2 |
| Navarre: | 8.8 |
| Mary Esther: | 3.5 |
| Orange Beach: | 2.6 |
| Foley: | 3.9 |
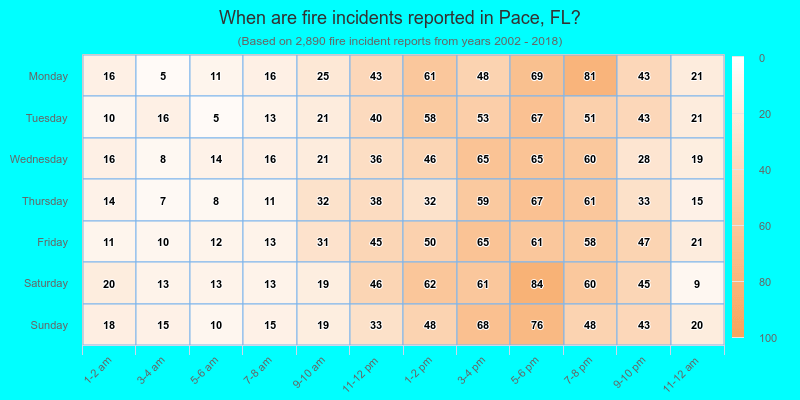
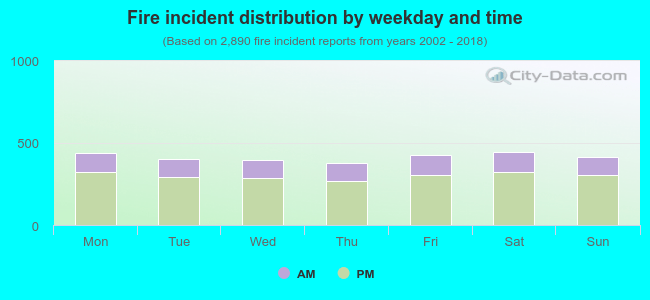 27.6% incidents where reported in the morning and 72.4% in the evening. The most fires (15.4%) took place on Saturday, and the least (13.0%) on Thursday.
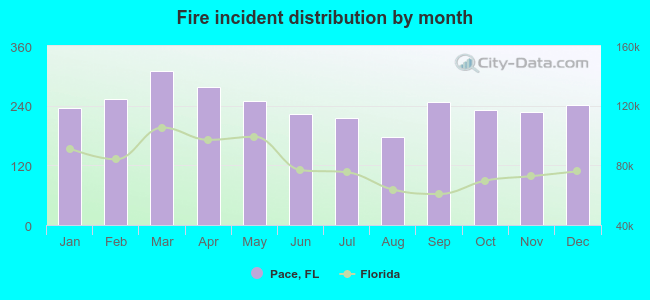 According to the 2,890 fire incidents from years 2002 - 2018 most fires (10.7%) took place during March, and the least (6.1%) in August.
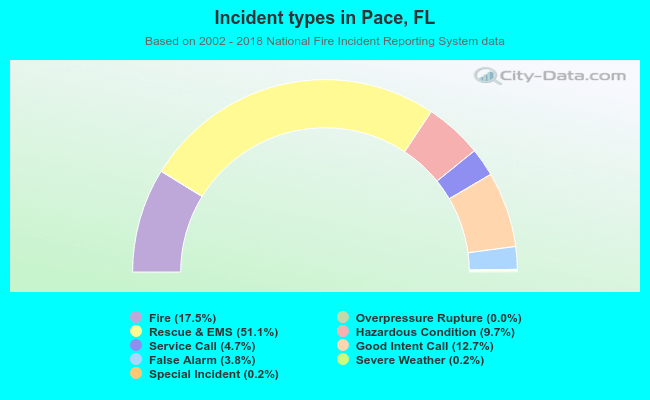 Out of all 16,472 cases reported during the years 2002 - 2018, the most belonged to the categories: Rescue & EMS (51.1%), Fire (17.5%), and Good Intent Call (12.7%).
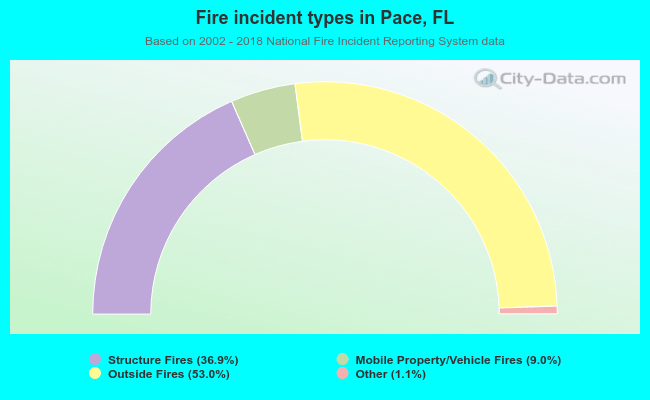 When looking into fire subcategories, the most reports belonged to: Outside Fires (53.0%), and Structure Fires (36.9%).